The Token Balance Distribution is an exclusive chart developed by Candlestick. This indicator illustrates the top 100 addresses with the highest amount of a particular token and the proportion of these addresses’ holdings in total supply.
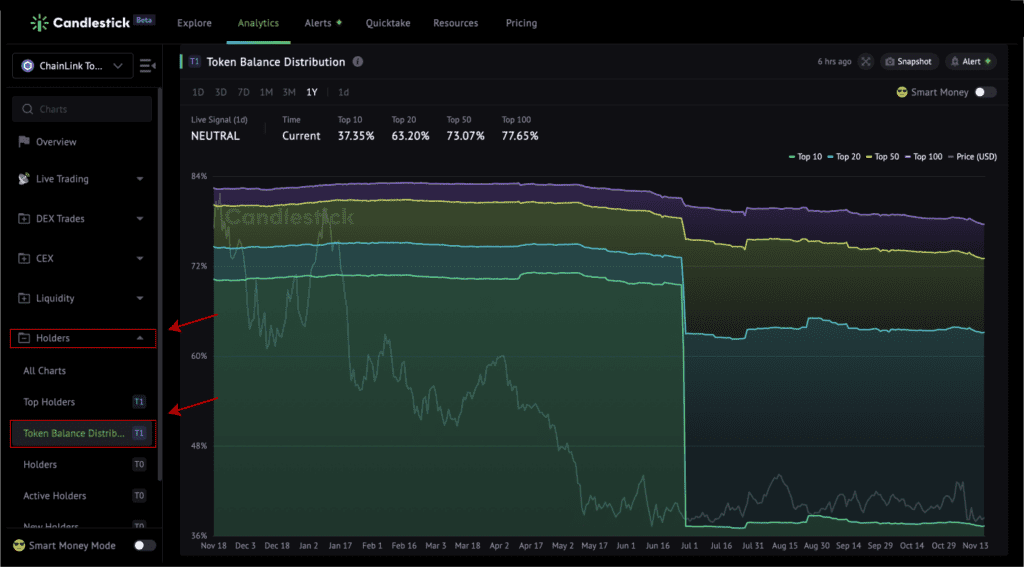
You can access this metric under the Holders category.
Metric Explanation
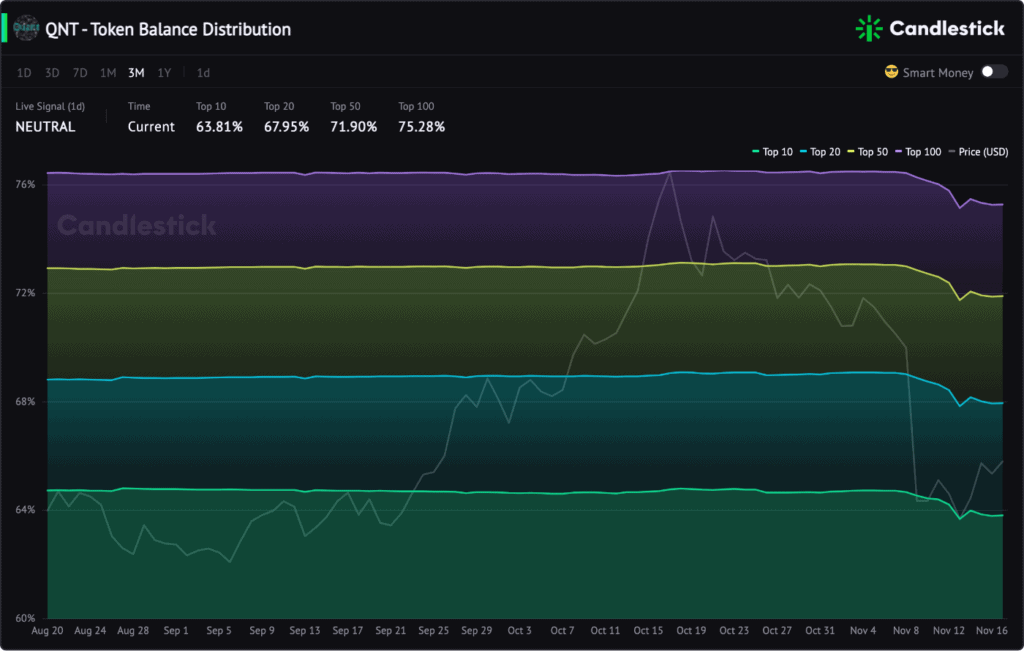
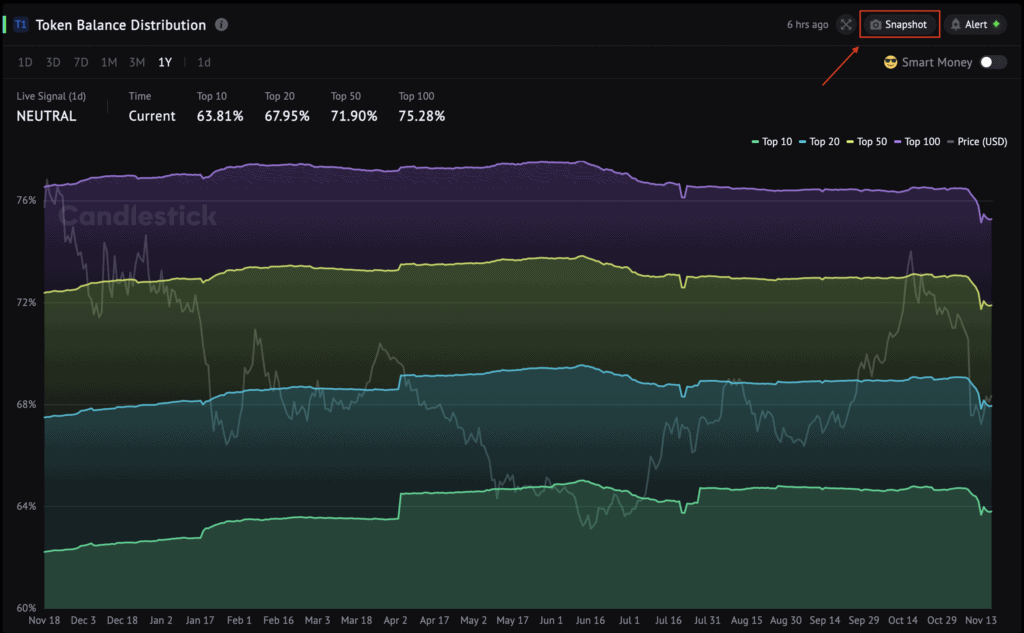
The Token Balance Distribution is a Percent Stacked Area Chart.
Area Series
- The green area represents the percentage of the total supply held by the top 10 addresses.
- The blue area represents the percentage of the total supply controlled by the top 20 addresses.
- The yellow area represents the percentage of the total supply owned by the top 50 addresses.
- The purple area represents the percentage of the total supply kept by the top 100 addresses.
Line
- The grey line shows the price movement.
Hidden Features
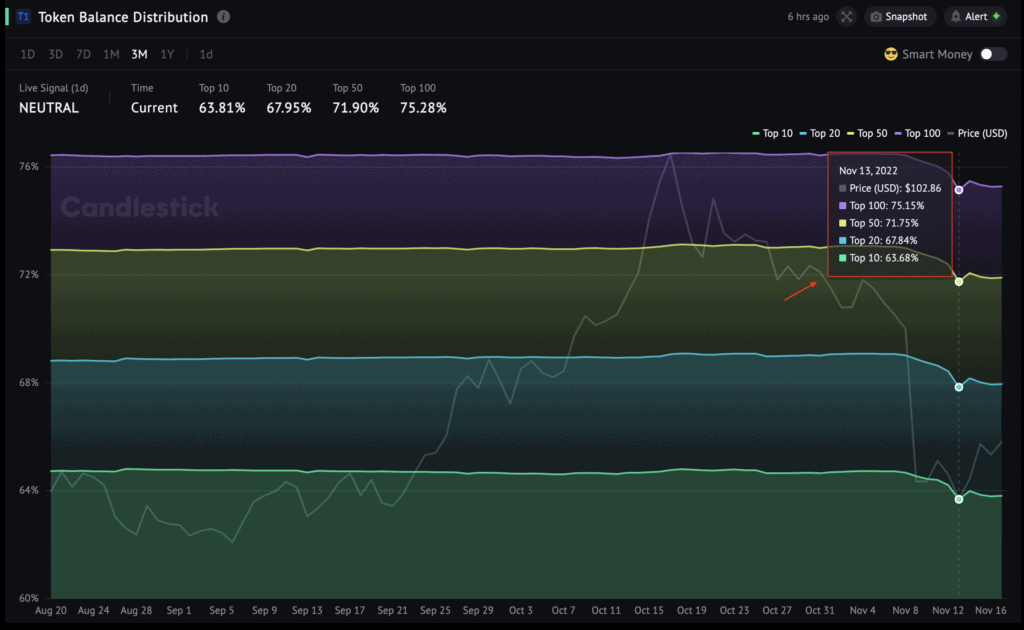
Hover to check
Hover around to check the exact numbers.
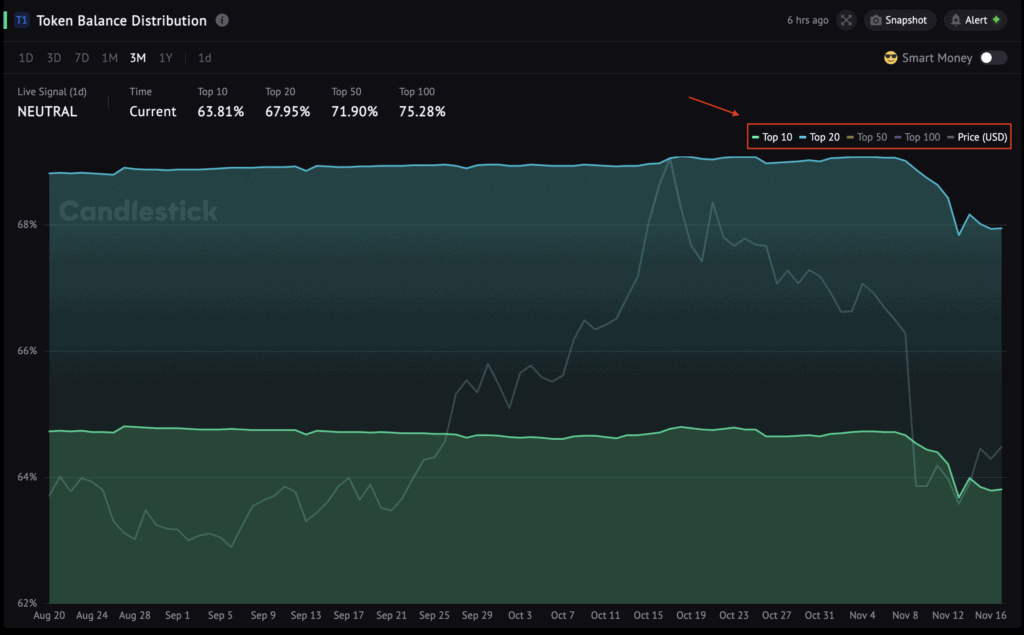
Hide or show
You can hide or show specific chart parts by clicking the symbols in the upper right corner.
Toolbar
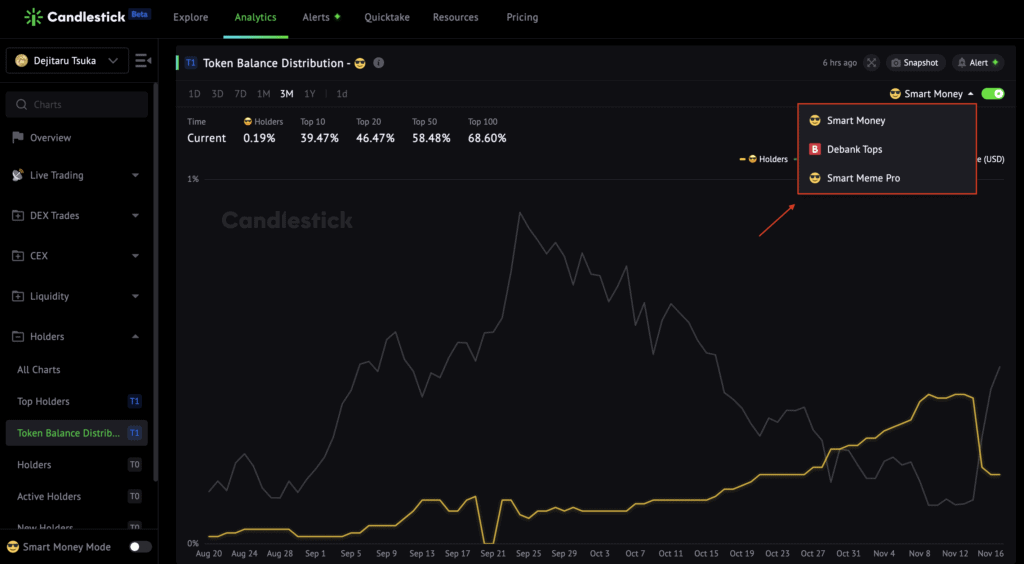
Switch Smart Money Group
Click the “Smart Money” toggle button. Next, hover over “Smart Money” and select groups in the drop-down list.
- “Smart Money”: default list of Smart Money addresses contains big-name VCs, angels, smart DEX traders, and DeFi OGs.
- “Debank Tops”: 1,608 addresses (min. $500K balance) from the top 10.000 of Debank’s web3 rank.
- “Smart Meme Pro”: a list of 925 best-performing addresses that traded at least 10 meme coins with a 70%+ win rate in 2022.
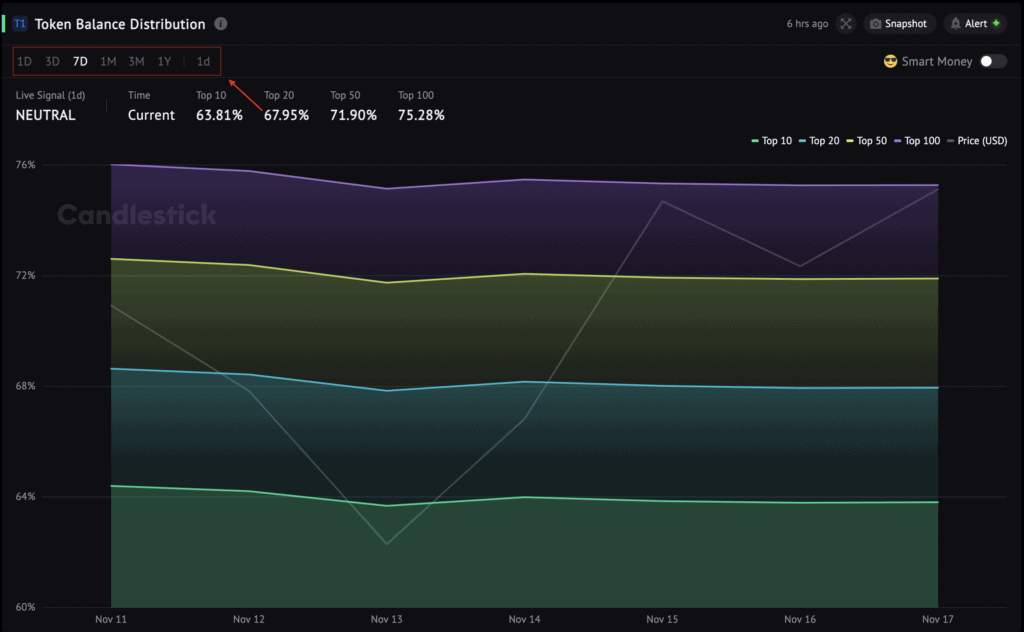
Switch Time
Click “1D, 3D, 7D, 1M, 3M, 1Y.”
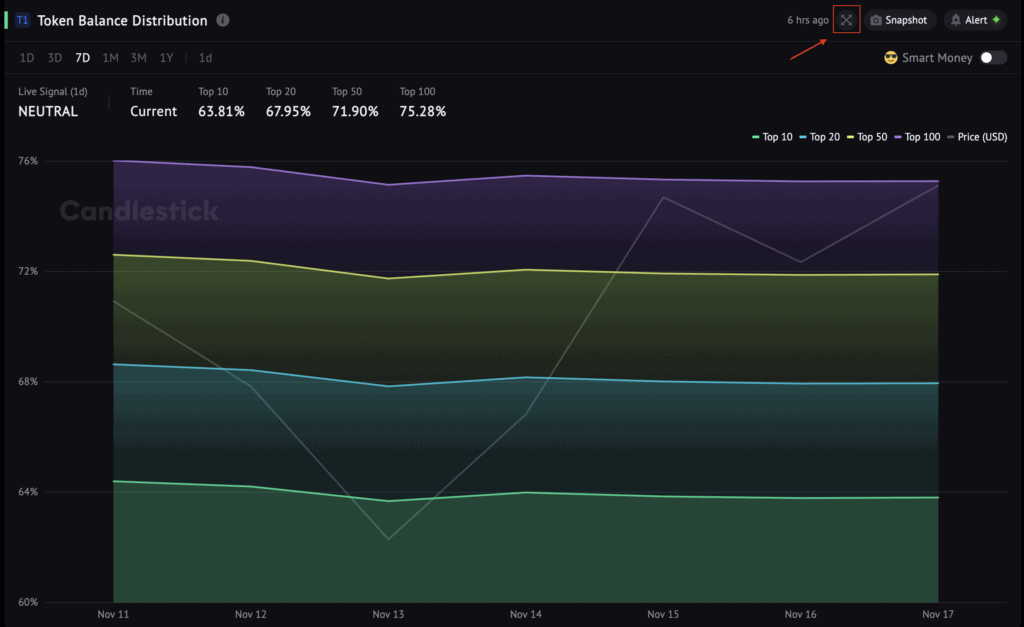
Enter Full Screen
Click the cross arrow.
Share or Download the Chart Image
Click the “Snapshot.”
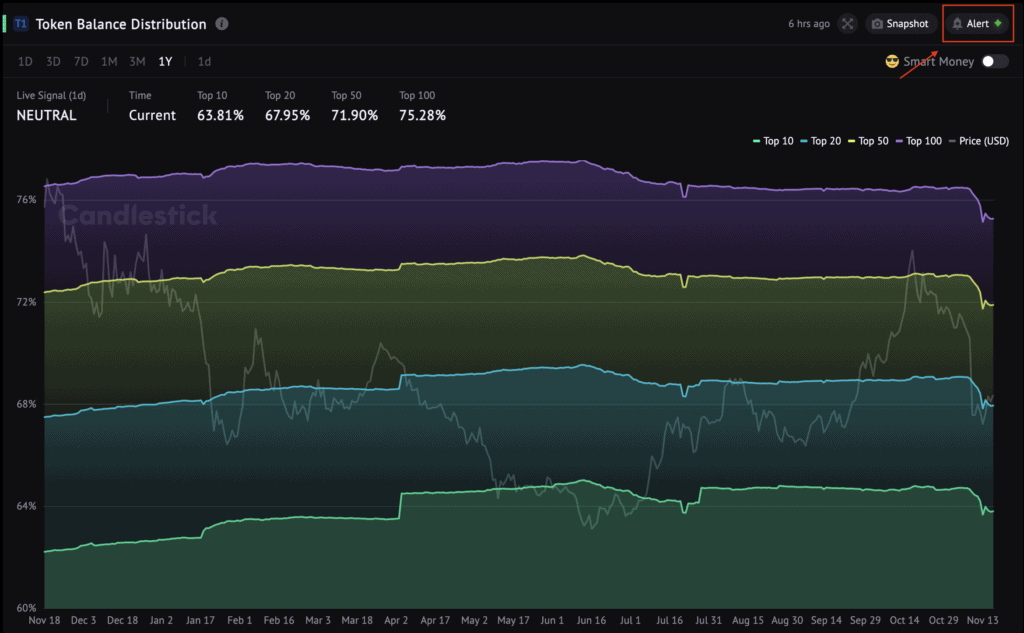
Set Up Alerts
Click the “Alert.”