

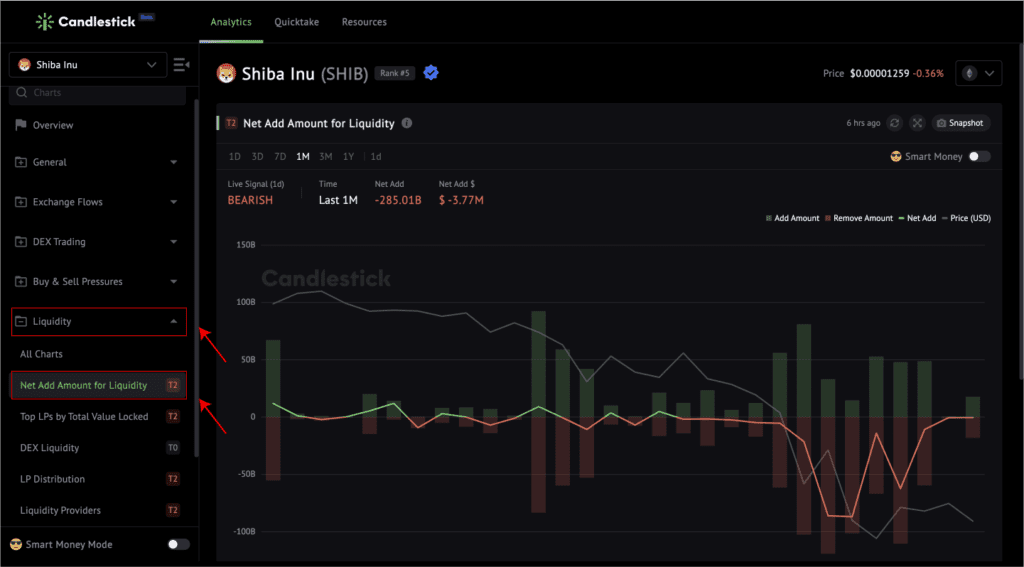
The Net Add Liquidity is an exclusive token indicator developed by Candlestick. It can reflect the real-time add and removal of tokens in the liquidity pool on the decentralized exchange (DEX).
You can access this metric under the Liquidity category.
Metric Explanation
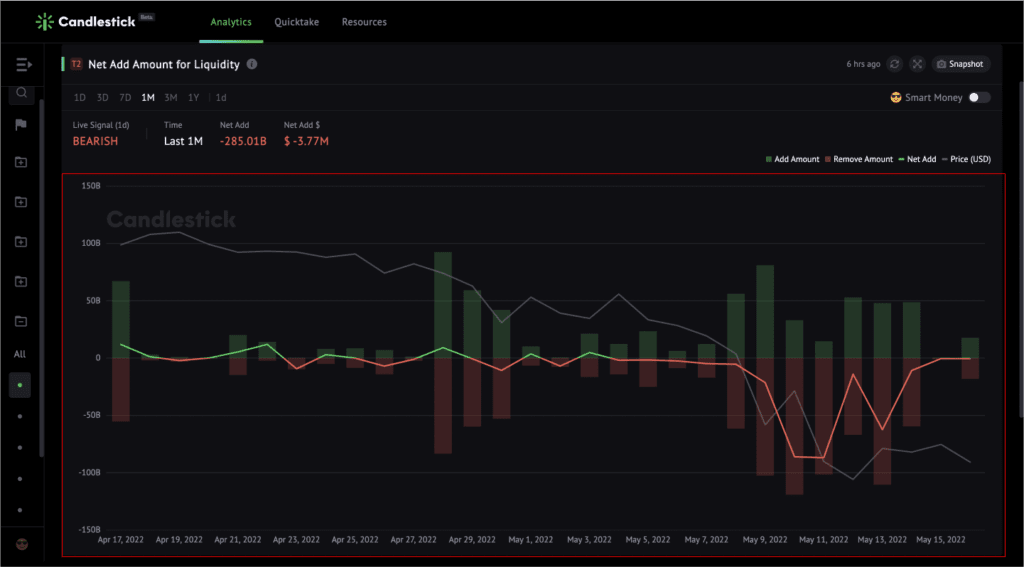
Bar
- Red bars represent the removed amount for liquidity.
- Green bars show the added amount for liquidity.
Line
- The line highlighted in green symbolizes a positive Net Add Amount for Liquidity.
- The line colored red represents a negative Net Add Amount for Liquidity.
- The grey line shows the price movement.
Hidden Features
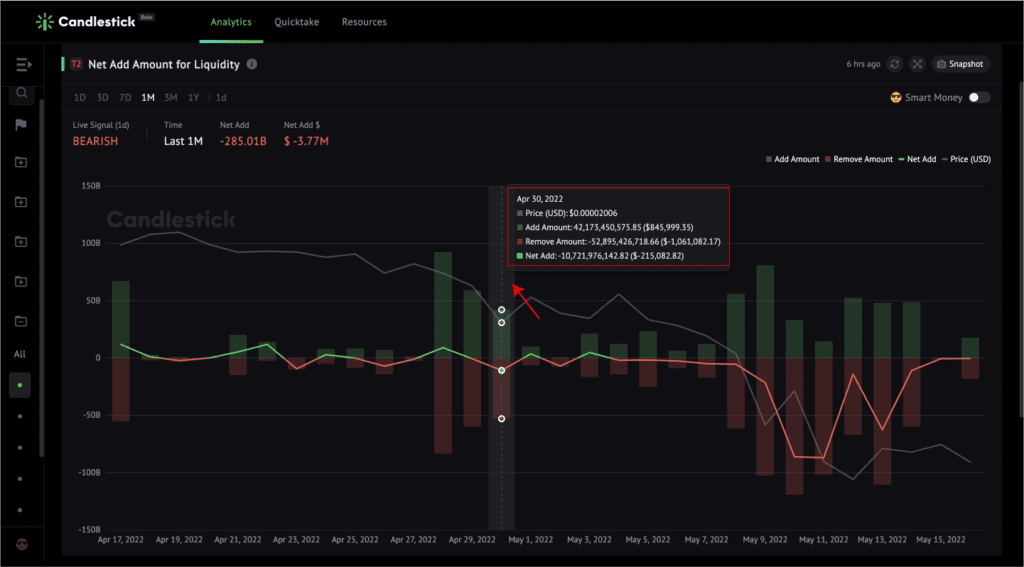
Hover to check
Hover around to check exact numbers, including price, add amount and $ value, remove amount and $ value, and Net Add Amount for Liquidity and $ value.
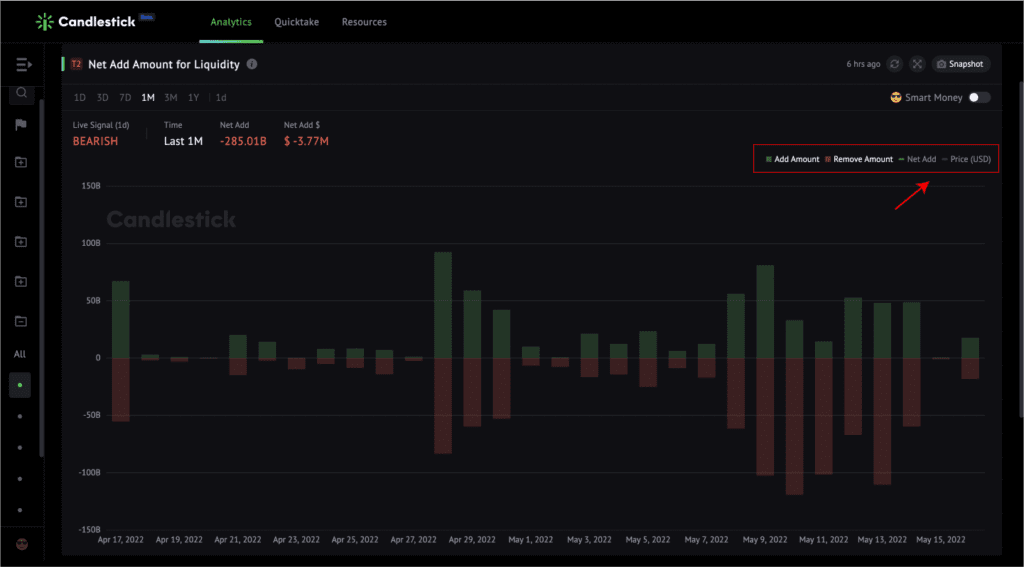
Hide or show
You can hide or show specific parts of the chart by clicking the symbols in the upper right corner.
Toolbar
Switch time
by clicking ‘1D, 3D, 7D, 1M, 3M, 1Y.’
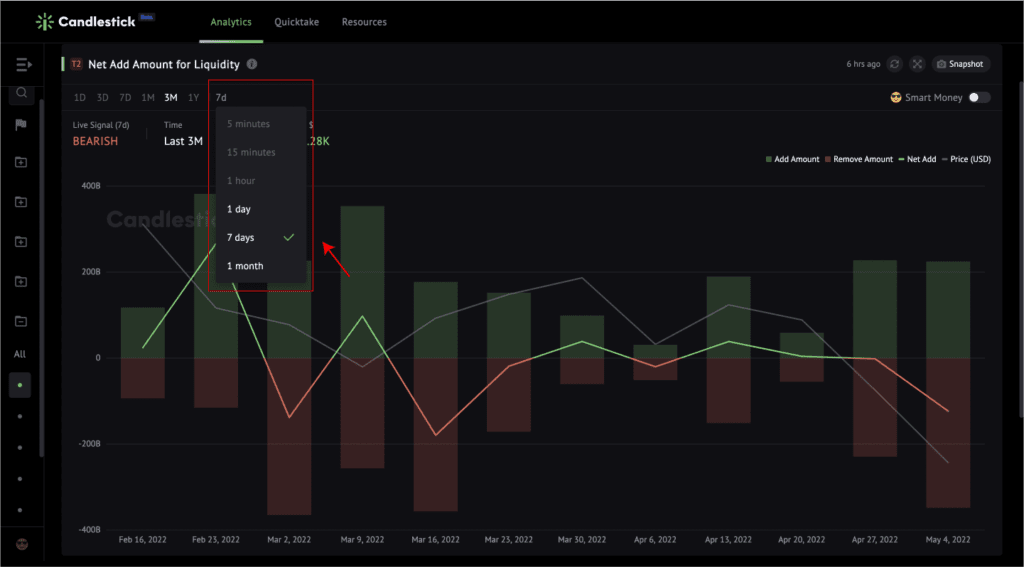
Change resolution
by clicking ‘5 minutes, 15 minutes, 1 hour, 1 day, 7 days’

Note: 5-minute, 15-minute, and 1-hour resolutions are available in 1d and 3d time ranges.
1d and 3d timeframes support 5-minute, 15-minute, and 1-hour resolutions. Likewise, 7d, 1M, 3M, and 1Y timeframes support 1-day and 7-days resolutions.
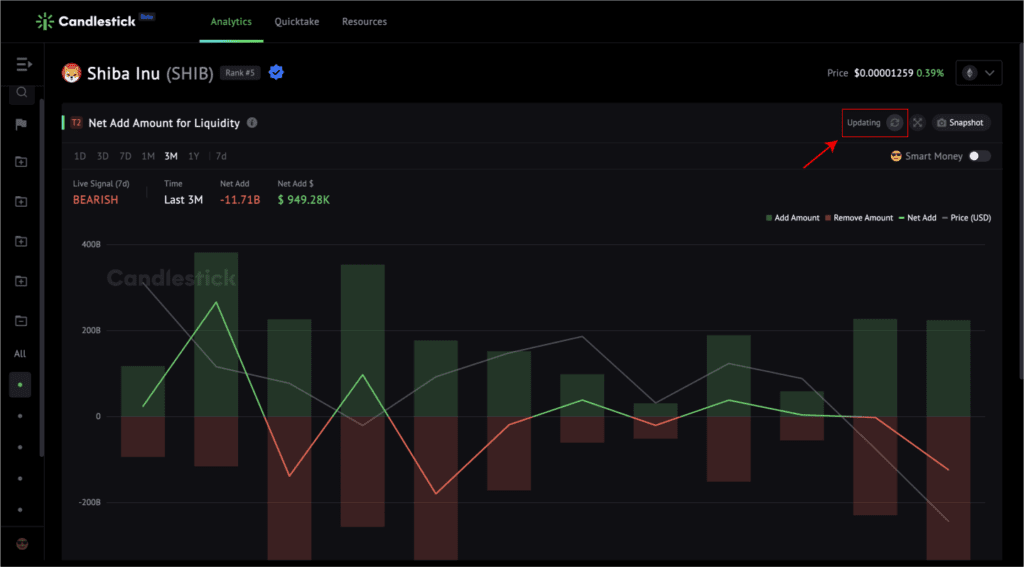
Update data
by clicking the loop arrow.
Full-screen
by clicking the cross arrow.

Share or download the chart image
by clicking “snapshot.”
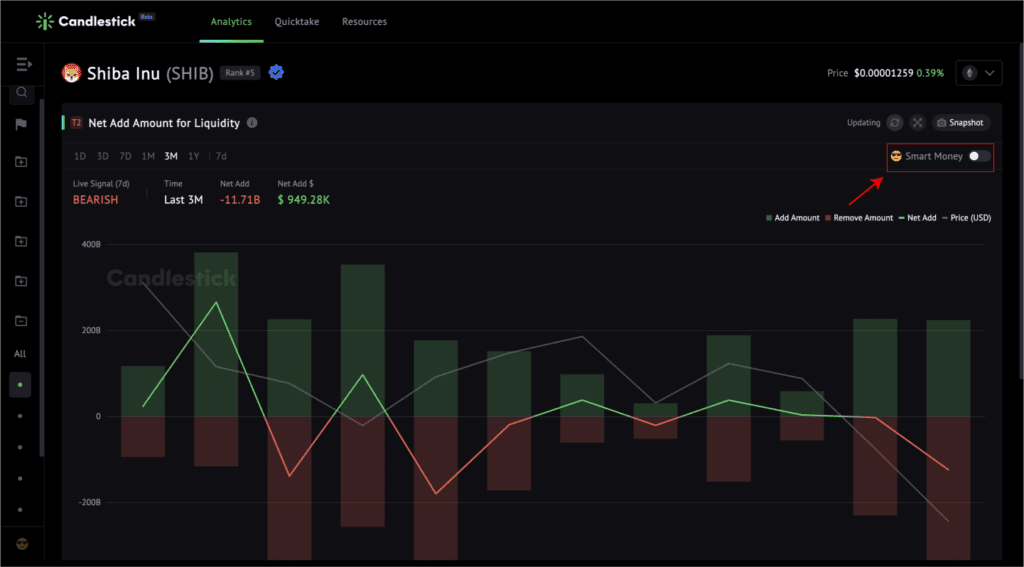
Switch to the smart money chart
by clicking the “smart money” toggle button.


