Quicktake
When selecting metrics, apply three steps for more accurate price prediction and analytics.
- Step 1: Multi-chain check for your target token.
- Step 2: Select DEX Trades, CEX, or Liquidity metric groups based on The Balances on Exchanges chart.
- Step 3: “Favorite” metrics to create your dashboard.
Check Token Signals On Multi-Chain
Some tokens deploy on multi-chain. You may capture a bullish signal on one chain but miss a bigger up on another if you don’t switch blockchains.
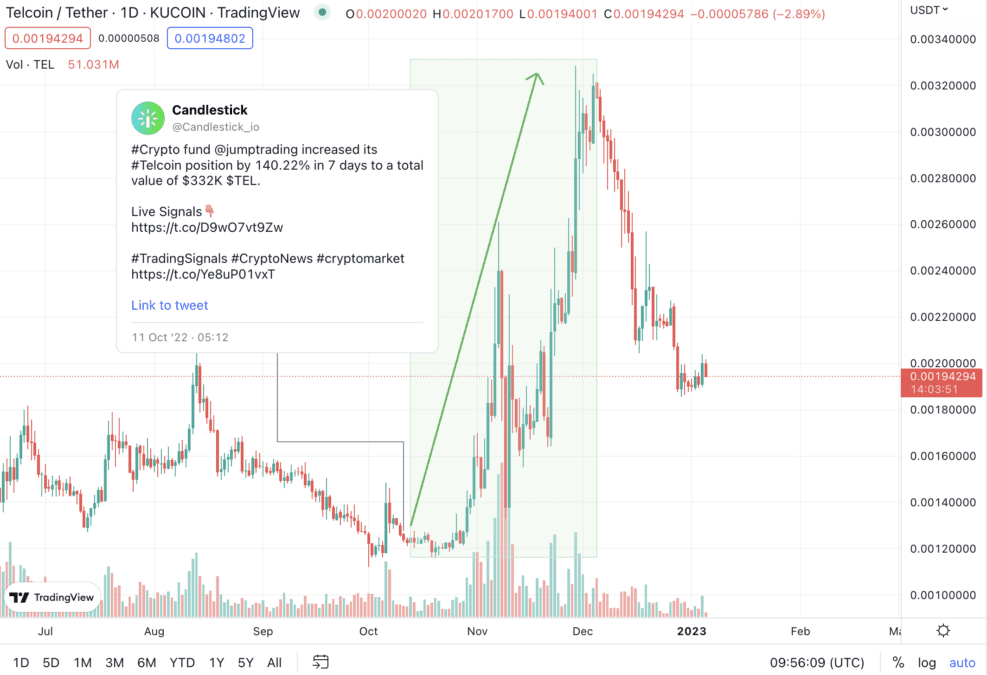
For example, Telcoin ($TEL) is circulating on Ethereum and Polygon.
On Oct 11, we observed token accumulation signals of Jump Trading on Ethereum. They increased their $TEL positions by 140.22% in 7 days to a total value of $332K.
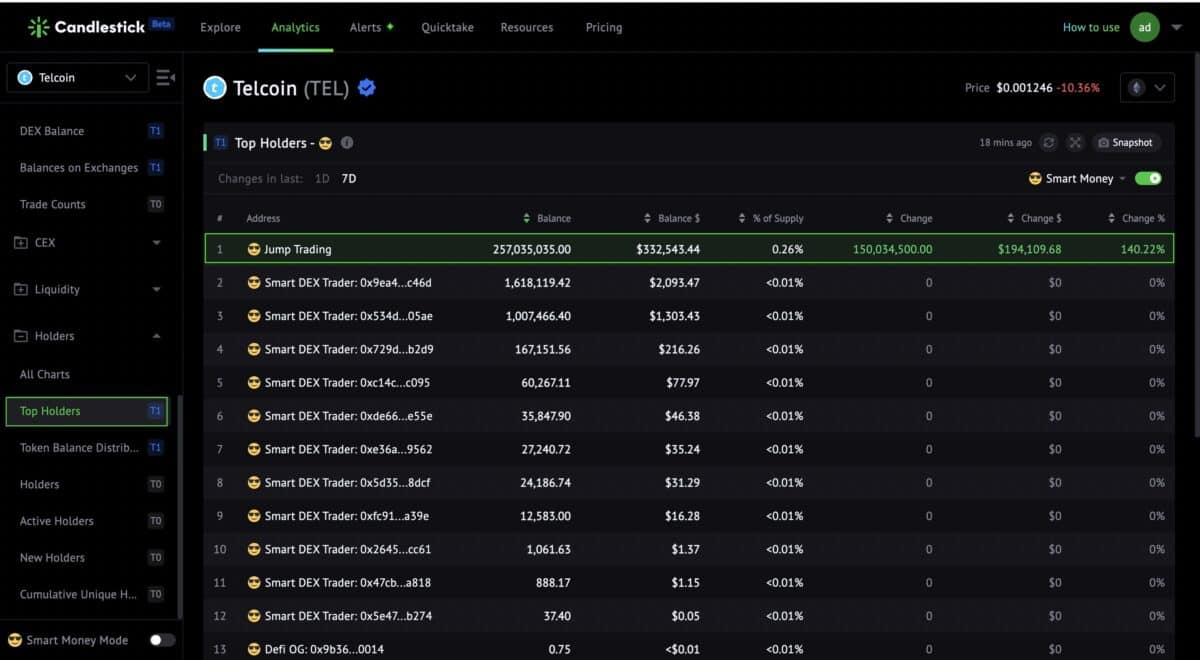
Data proved this crypto fund prepared well before the significant price surge – $TEL skyrocketed 166% over the next two months.
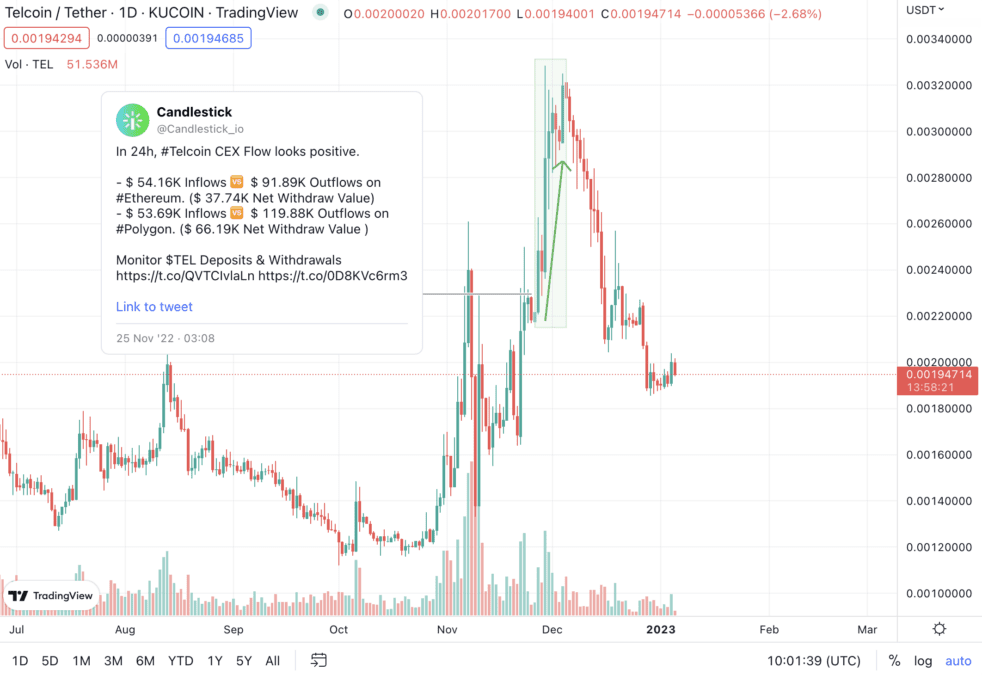
On Nov 25, $TEL CEX Flow on Ethereum and Polygon recorded bullish signals simultaneously – Traders withdrew tokens to on-chain wallets.
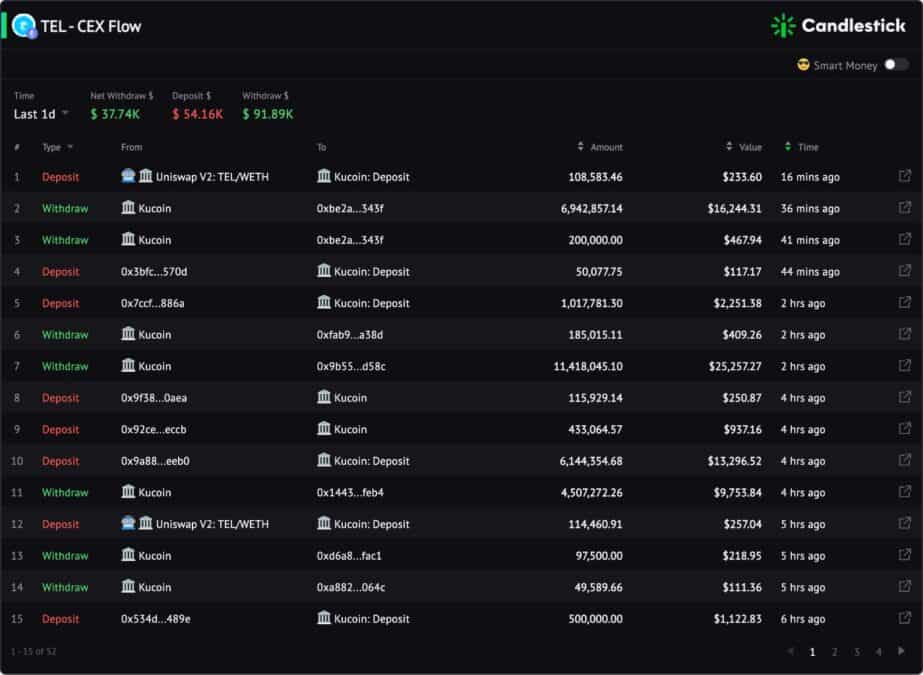
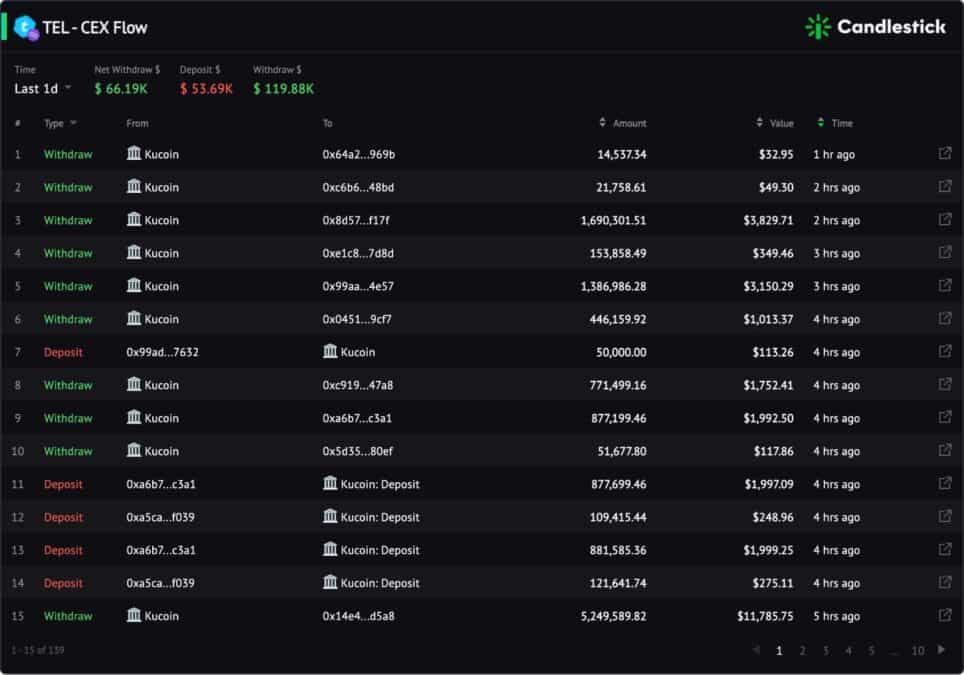
It was an entry point if you captured this signal. After a short retracement on that day, $TEL climbed higher.
We’ve integrated with BNB Chain; it’s good news for hunters chasing BSC Gems.

Select Relevant Metric Groups
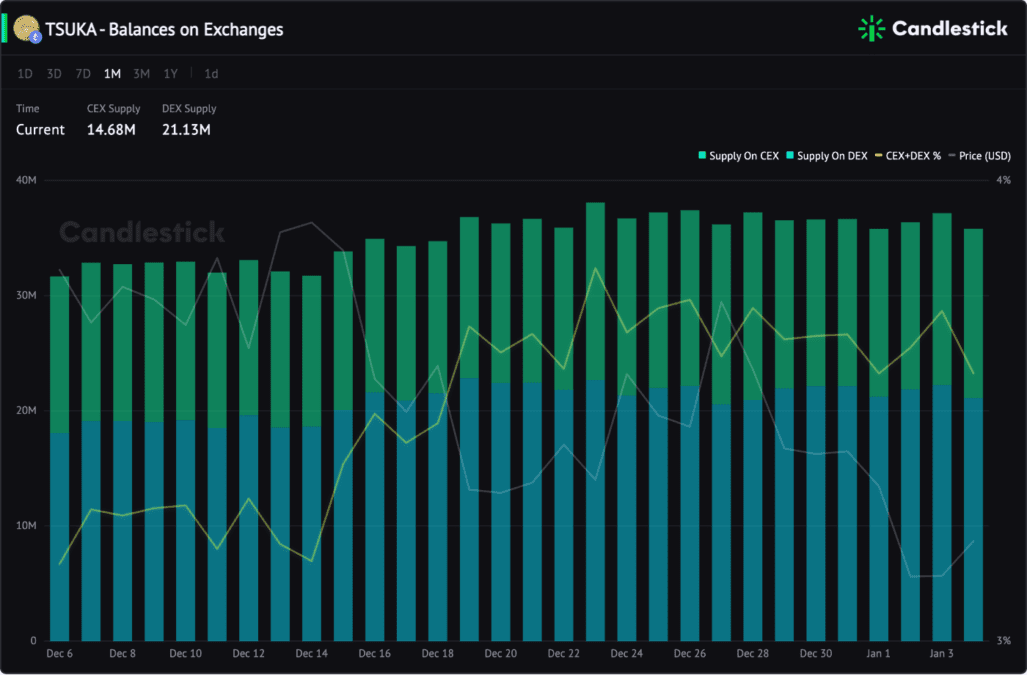
Before you trade, check the Balances On Exchanges chart to understand the distribution of the circulating supply. Then choose the most related indicator groups.
A token’s Balances on Exchanges refer to the token amount circulating on CEXs and DEXs. These tokens are available to the public for trading on exchanges and thus could affect the price.
- Supply is mainly on CEXs: Check the CEX Metric Group.
- Supply is primarily on DEXs: Check the DEX Trades & Liquidity Groups
- Almost 50/50 Supply: Check CEX, DEX Trades & Liquidity Groups
Two examples show you tricks.
Example 1: $TORN
$TORN CEX supply is significantly higher than the supply on DEX. Inflows and outflows are more sensitive to price than trades on DEX.
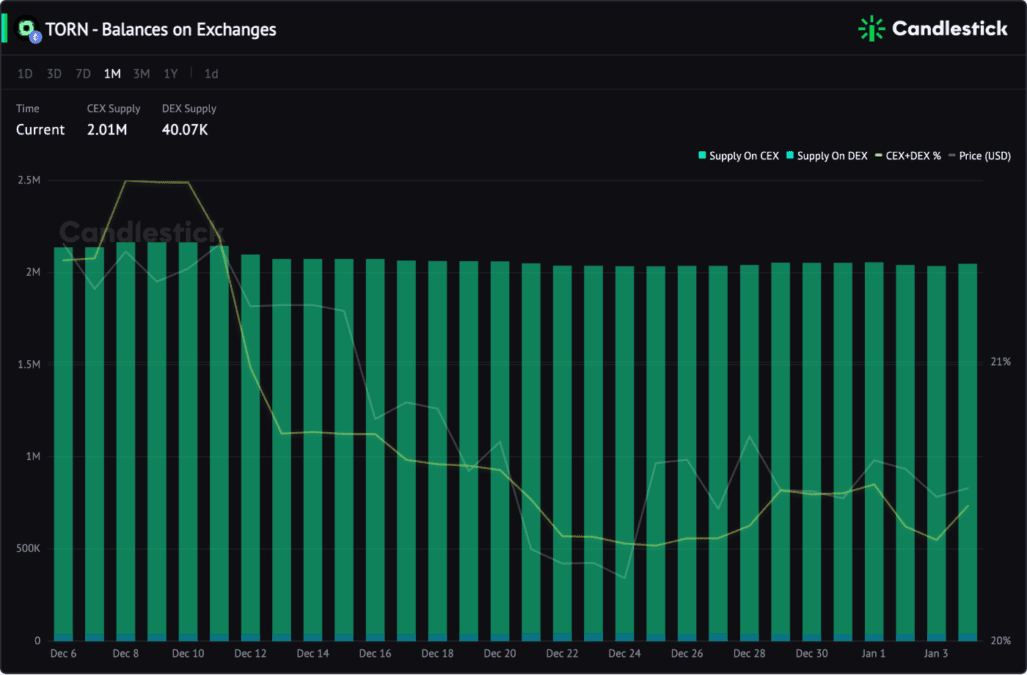
A story in Aug proved it.
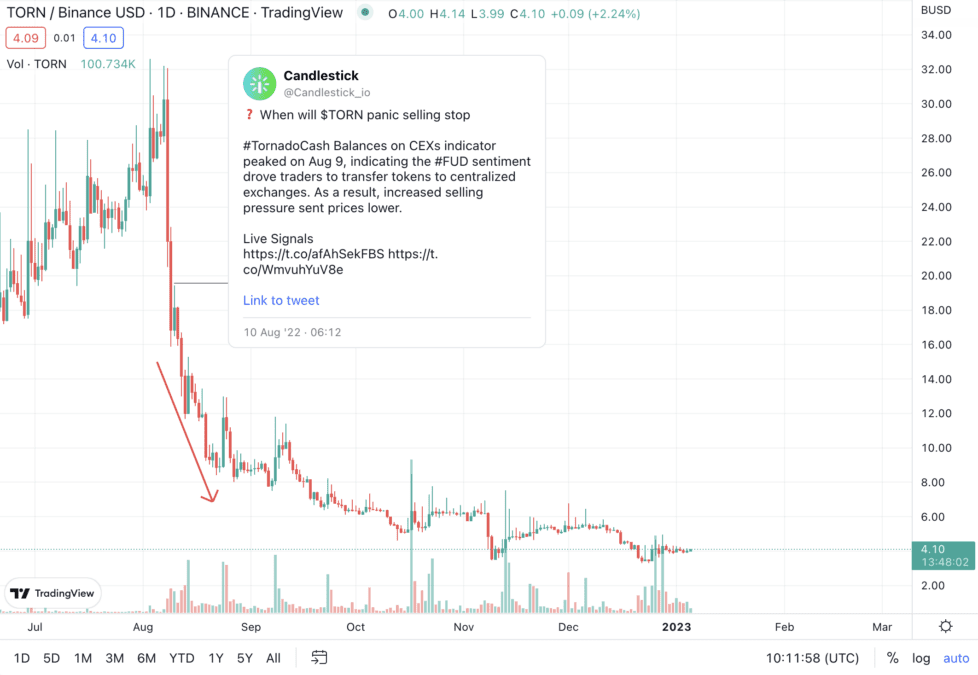
$TRON Balances on CEXs peaked on Aug 9. The FUD sentiment drove traders to transfer tokens to centralized exchanges. As a result, increased selling pressure sent prices lower.
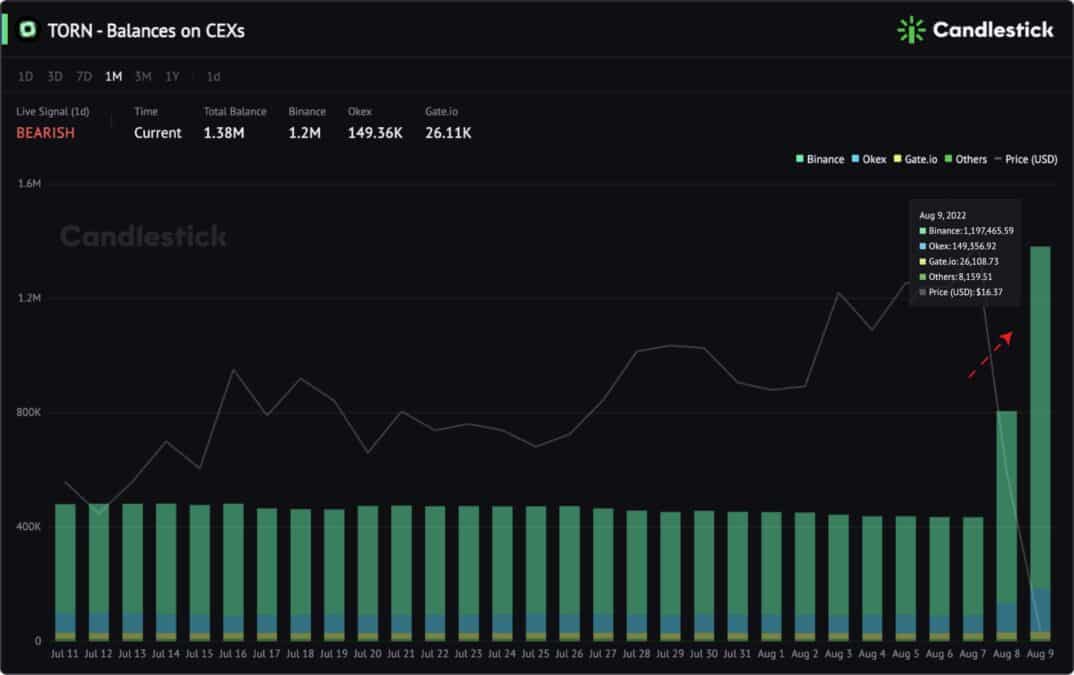
Although a green candle was seen on Aug 10, the heavy inflows crashed the token price.
CEX Charts Recommendation
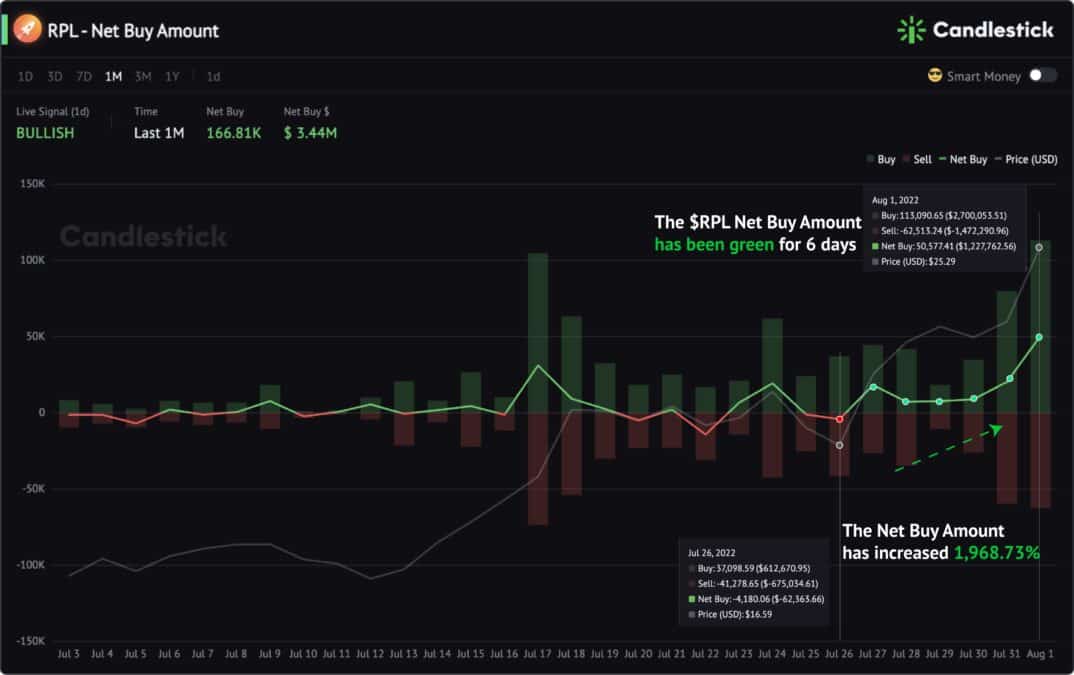
Example 2: $RPL
$RPL DEX supply is 11x the CEX supply. So checking DEX Trades and Liquidity metric groups is more critical.
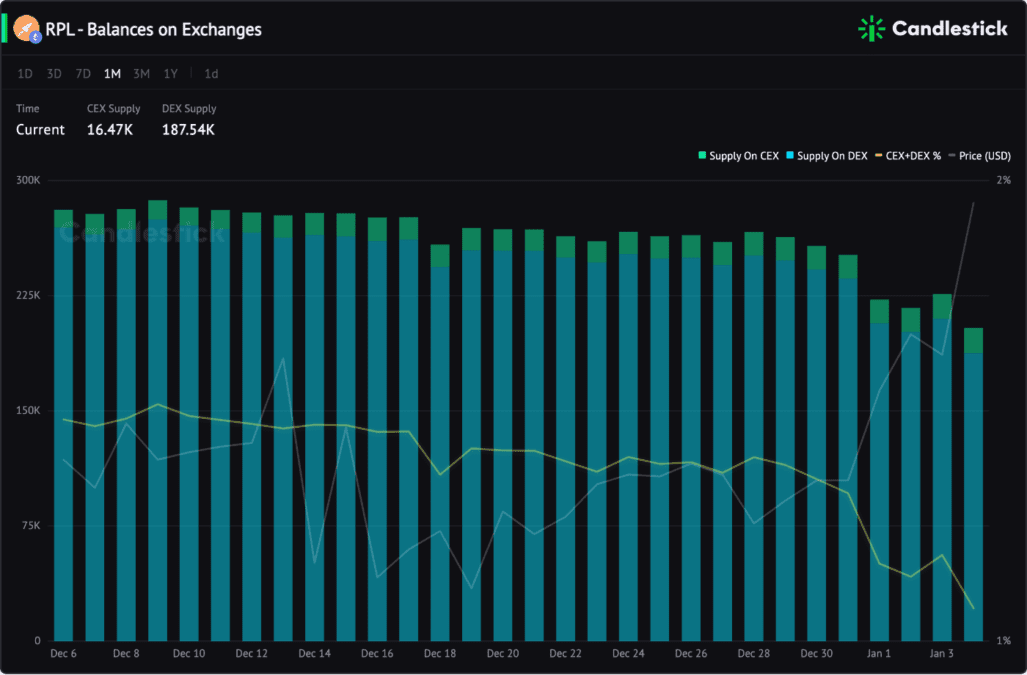
In Aug, we shared bullish signals of $RPL. The Net Buy recorded consistent green and increased 1,968.73% since Jul 26.
$RPL Net Add Liquidity surged 5,091.96% and hit an all-time high on Aug 1. In addition, liquidity providers added $5M in a single day.
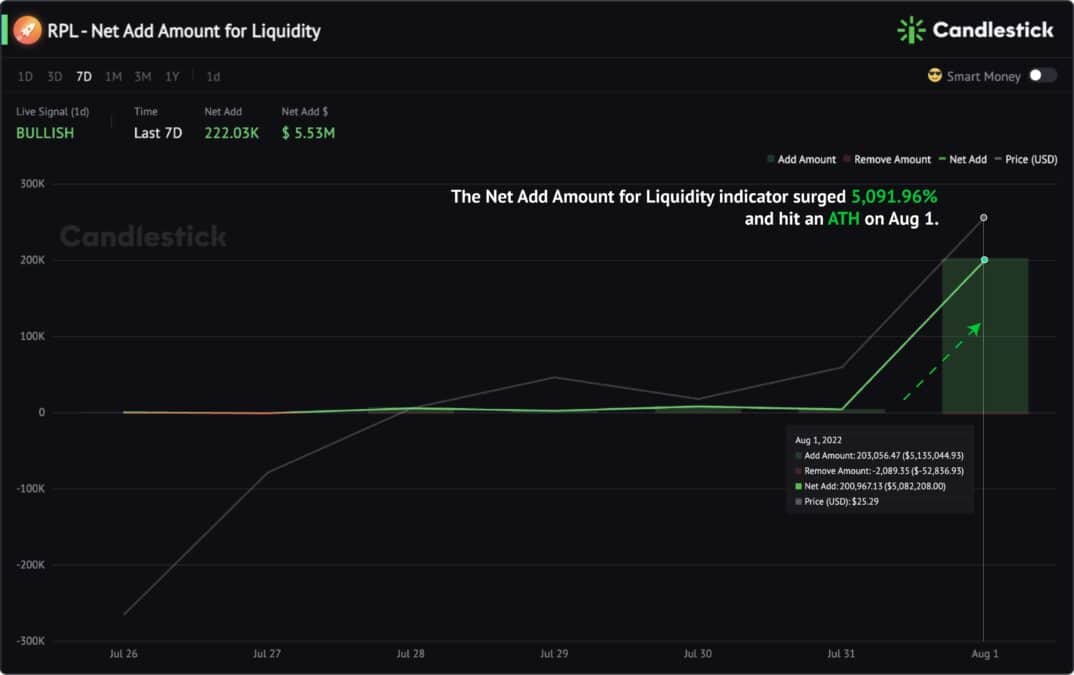
Those bullish signals reflect traders’ positive perspectives on Rocketpool before the ETH merge. As a result, the RPL price kept climbing in the next three weeks.
DEX Trades Charts Recommendation
Liquidity Charts Recommendation
Sometimes you will find that the circulating supply of a token is split between DEX & CEX. In that case, you should check both CEX, DEX & Liquidity indicators.
We’ve written guides for this situation. Apply the trader tips – How to Predict Price Movements Based on Candlestick DEX Trading, CEX Flow, and Liquidity Indicators
Or check this thread on Twitter.
Customize Metric Dashboard
Select charts you like by simply clicking “Favorite.” Create a dashboard combining your trading styles and our tips.