Quicktake
- The increase & decrease of the Net Buy Value indicator represents the sell and buy actions on the decentralized exchanges, which can directly influence the rise & fall of the price.
- When deposits on centralized exchanges increase, such as the Net CEX Outflow indicator records negative peaks, the price will fall after a while.
- When liquidity providers remove their tokens from DEX pools, it takes some time to cause sell pressure and drive the price down. Track the Net Add Liquidity, Add/Remove Liquidity to stay tuned.
Net Buy Positive Peaks: Real-Time Strong Buying
The Net Buy Value indicator reflects the change in selling and buying pressure that leads to price shifts.
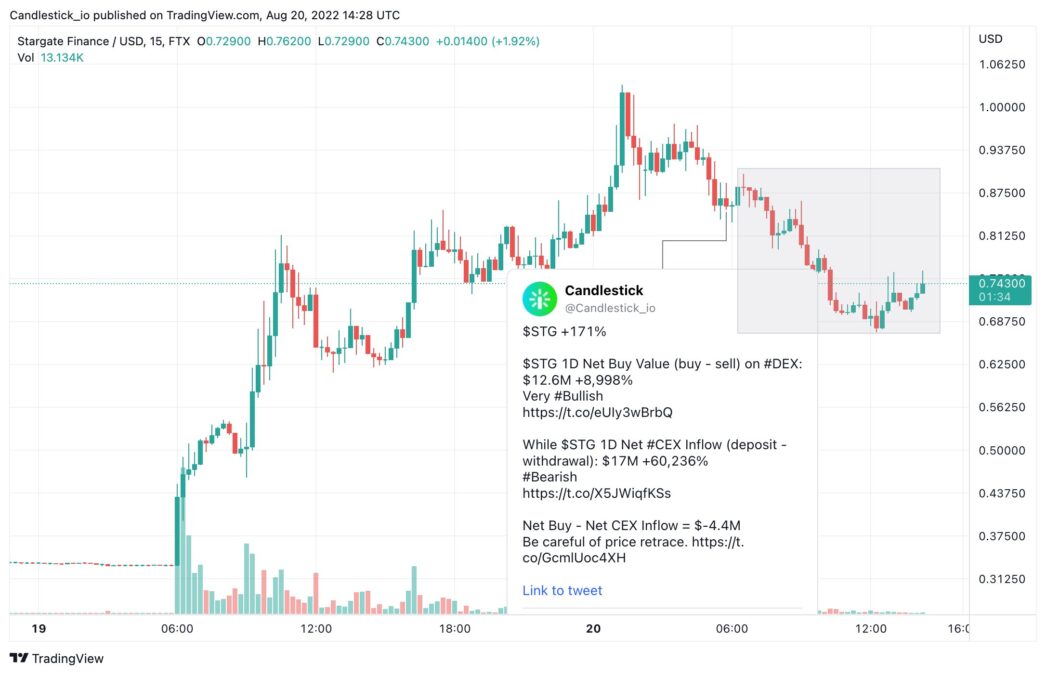
For example, on Aug 19, the Net Buy Amount indicator peaked when Binance announced the STG token launch. The sudden surge in Net Buy resulted from people seeing the listing as positive news and rushing to buy more coins.
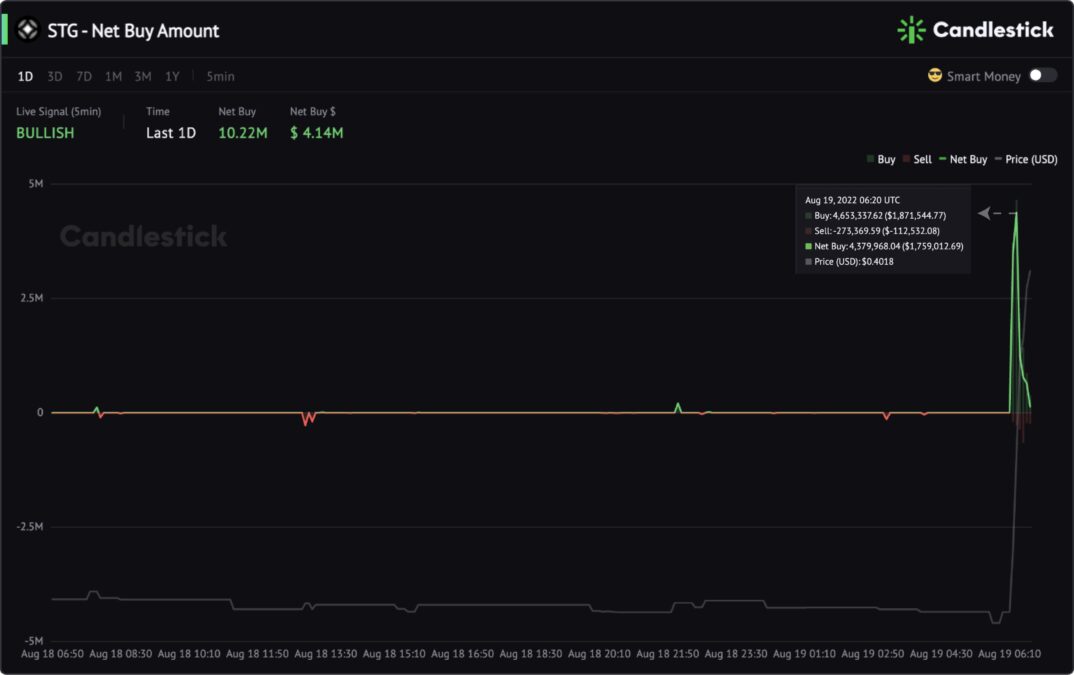
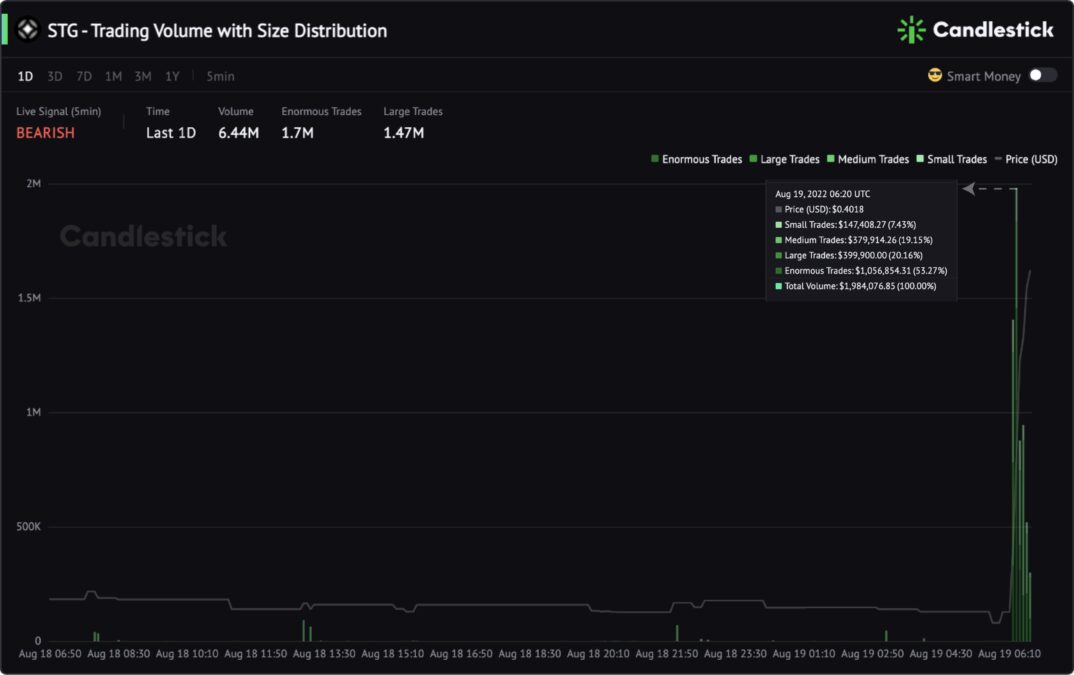
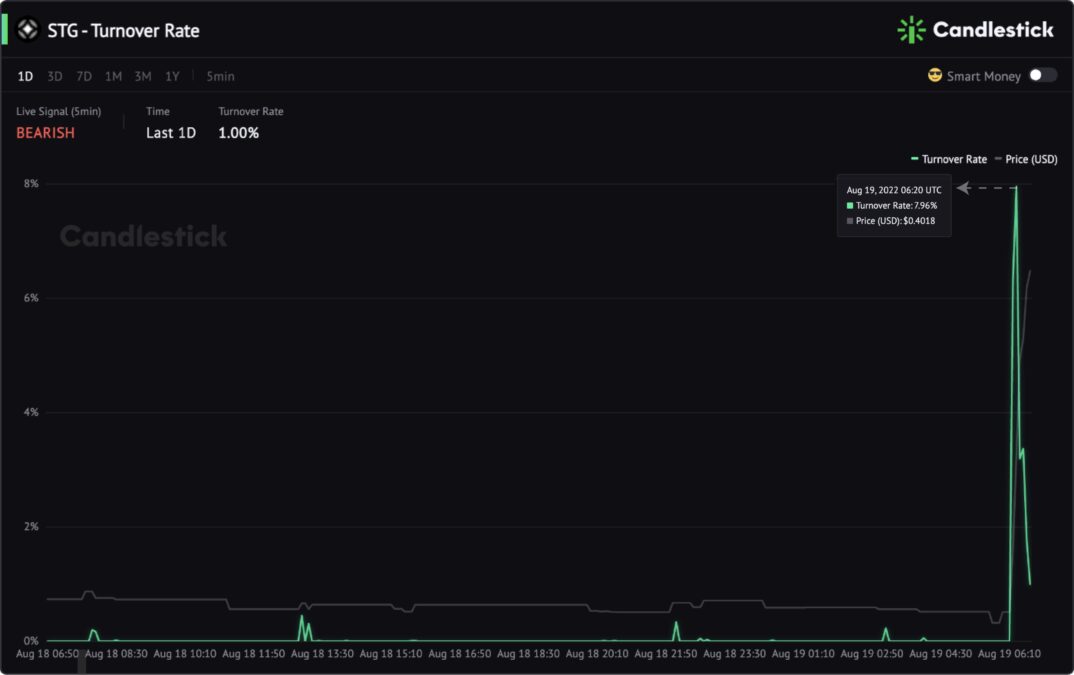
After the indicator formed a green peak, we combined The Turnover Rate and Trading Volume indicators to validate that the price would rise substantially. STG surged 171% after that.
In addition to the Net Buy, these metrics can better help you gain insight into price changes.
Large CEX Deposits Increases: Price Plunge Warning
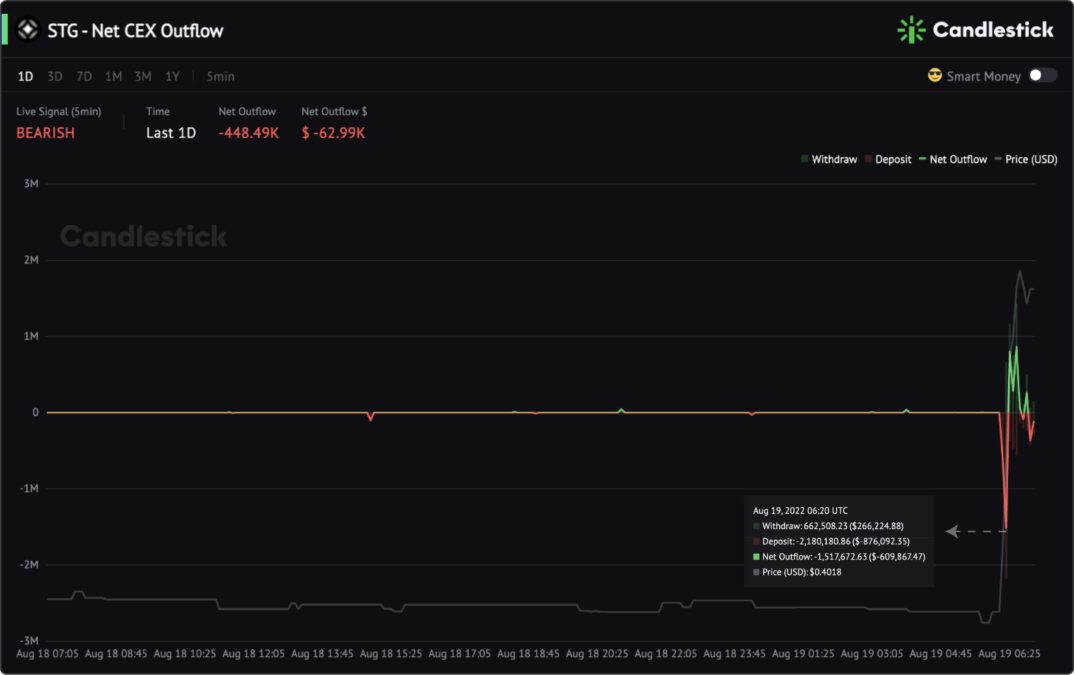
The Net CEX Outflow monitors the value of deposits minus withdrawals on centralized exchanges. When red peaks representing inflows form, be careful of price retrace.
In the previous example, when the STG Net Buy Amount peaked, we noticed that the Net CEX Outflow turned negative, indicating the selling pressure was brewing simultaneously.
On Aug 20, STG’s Net Buy Value on decentralized exchanges increased by 8,998% and still be positive. However, the Top CEX Net Inflow leaderboard (Based on the Net CEX Outflow indicator) alerted that deposits on centralized exchanges surged 60,236% in 24 hours.
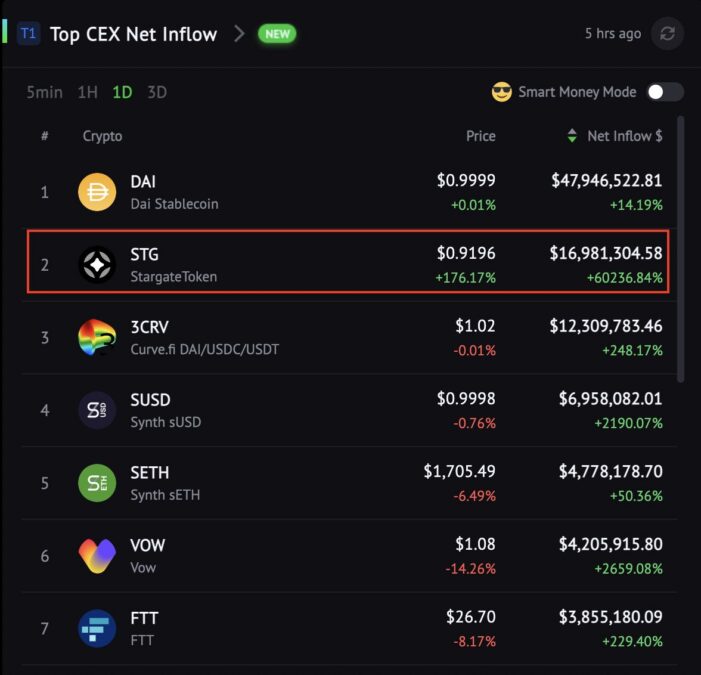
It was an early warning of a price drop when people were still FOMO as the price was pumping. A few hours later, STG dropped 17% after the “price retrace” alert of our exchange flow indicators.
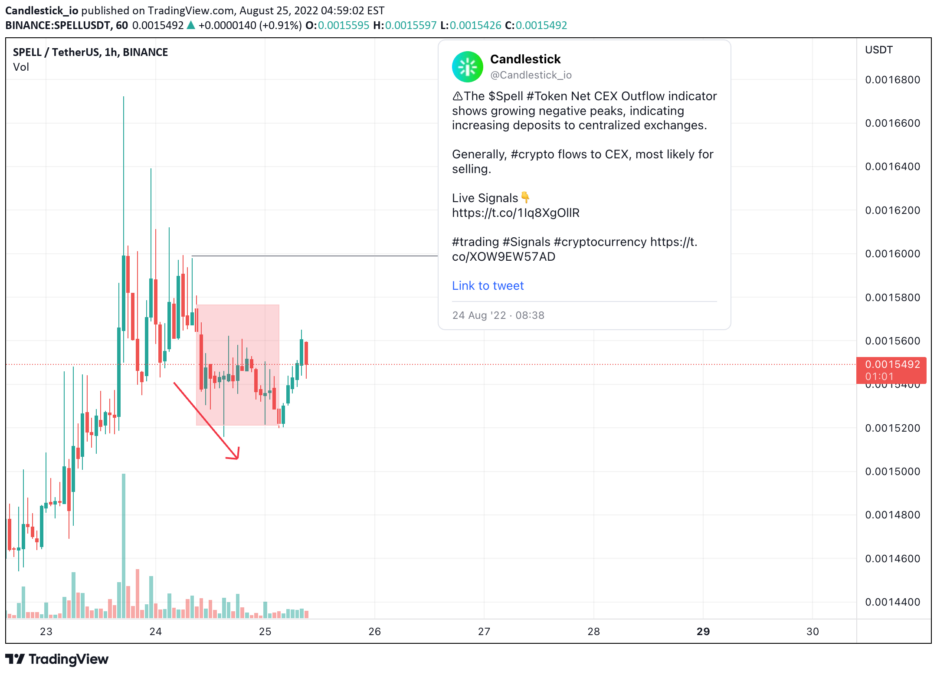
SPELL token is another example. The Net CEX Outflow indicator detected growing negative peaks, indicating increasing deposits to centralized exchanges at 8:00 UTC Aug 24.
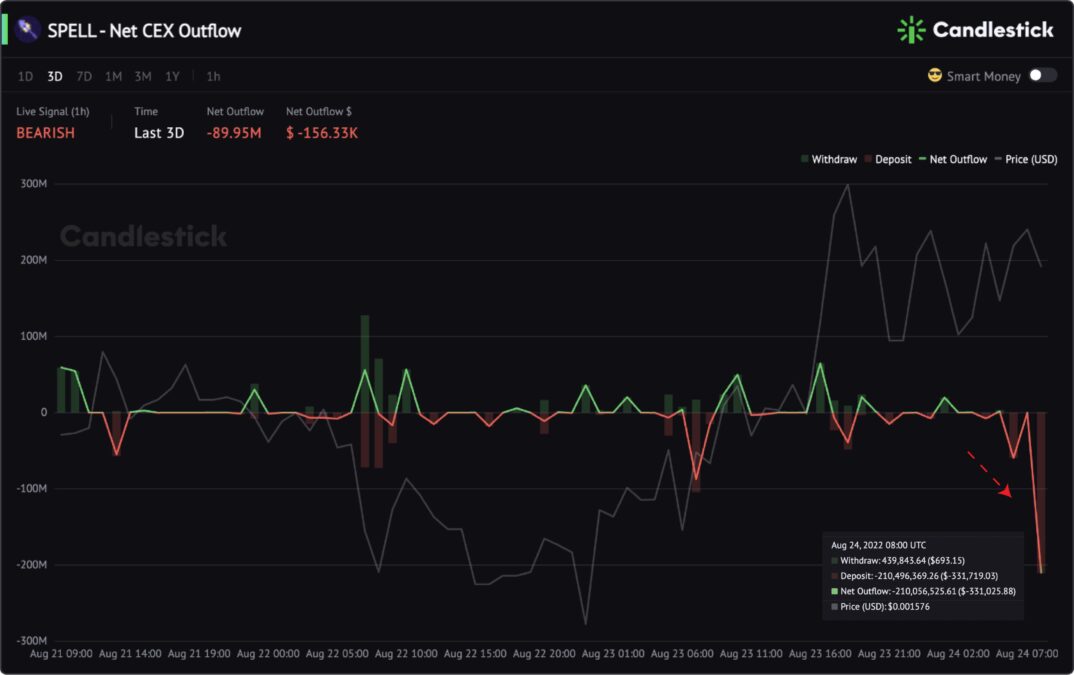
The price went down 1 hour later, dropping 5.36%. That’s how crypto inflows drive the price down, which always happens after a while.
More indicators for tracking exchange flows:
Liquidity Removed: Price Change Alert
Removing Liquidity is a bearish reflection by liquidity providers that cause upcoming sell-offs.
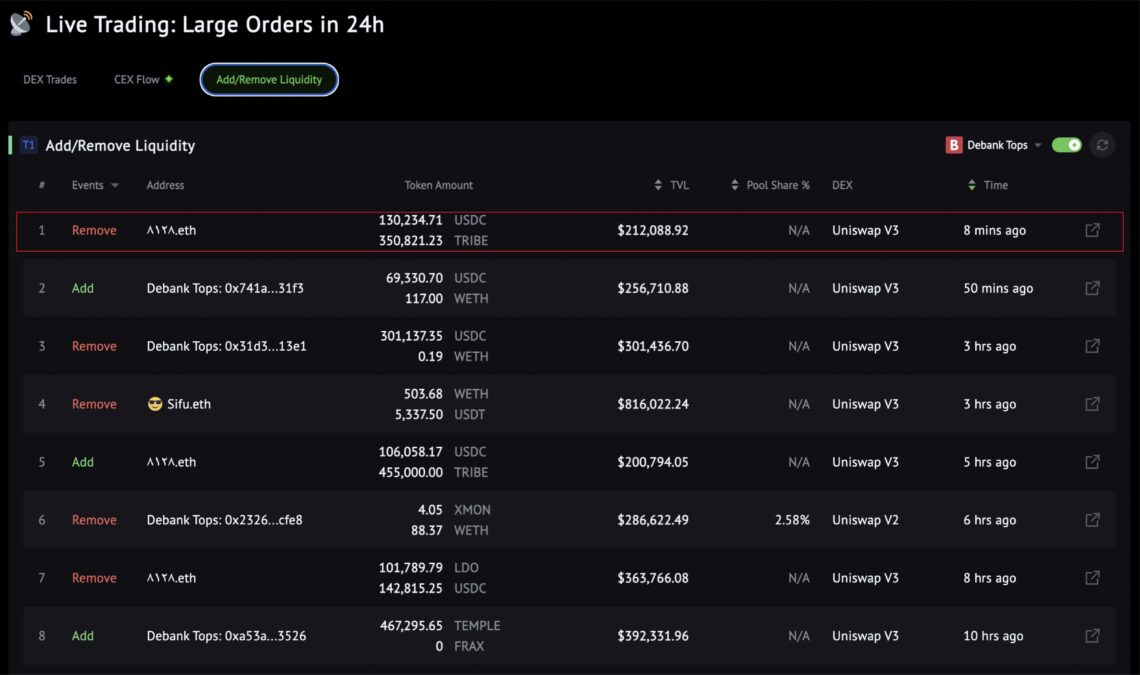
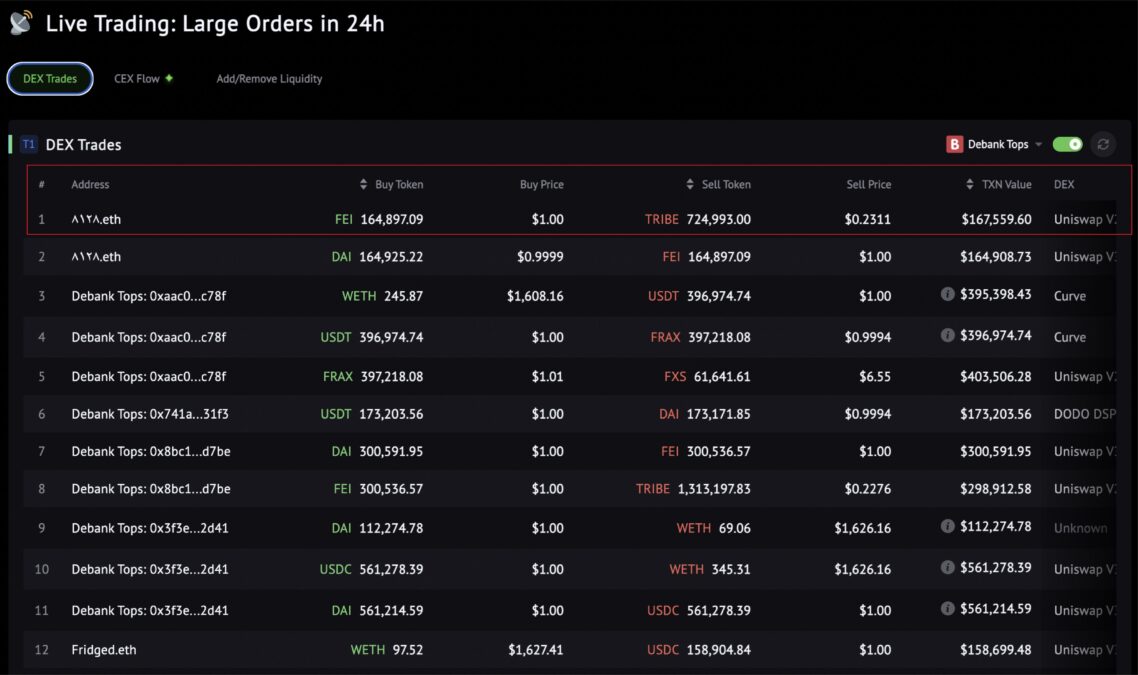
For example, on Aug 23, the Live Trading Large Orders indicator observed one of the “Debank Tops” removed TRIBE liquidity and sold $167K worth of tokens after a while. This process explains why removing Liquidity is a negative signal; once liquidity providers remove it, they may turn to sell.
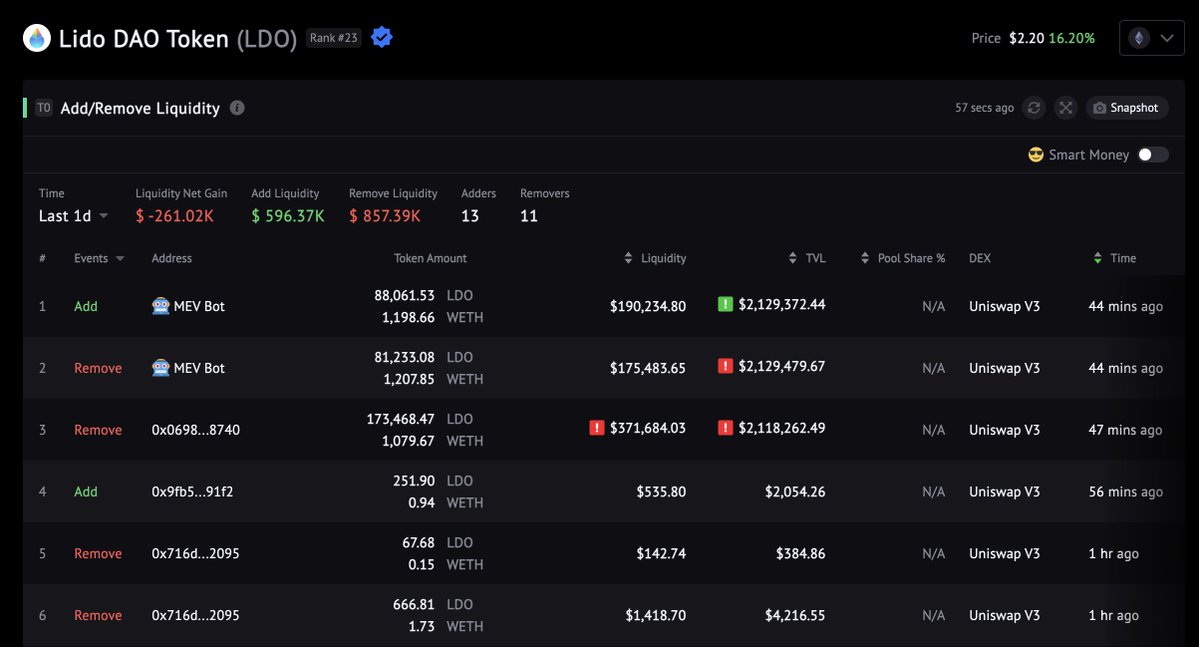
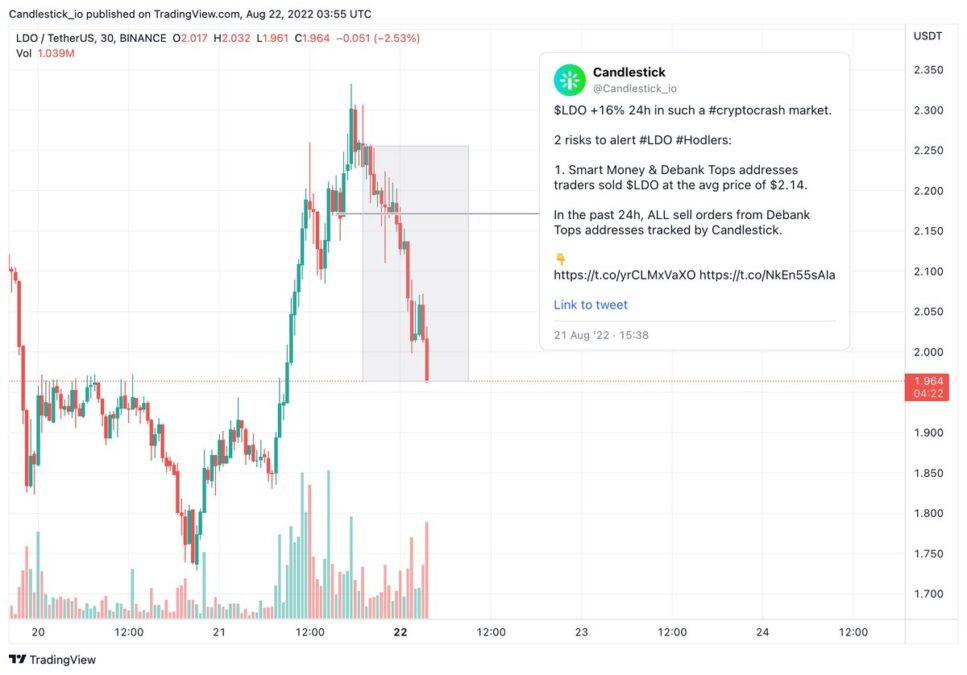
So, the liquidity-related action does affect the price, but the effects usually happen later. For instance, the LDO token raised 16% in 24 hours on Aug 21, a crypto crash day.
The Real-Time Add/Remove Liquidity indicator detected that liquidity providers removed 2 million TVL from LDO/ WETH pairs on Uniswap V3. As a result, net liquidity gain in 24h was $-261K.
On Aug 22, LDO experienced a price retrace after the risks alert by Candlestick liquidity indicators.
More Liquidity-related indicators: