Quicktake
- Net Buy Value + Turnover Rate metrics indicate a short-term price top.
- CEX Deposits + Liquidity Removal reveals a long-term price top.
- Topping signals appear before a reversal occurs.
Topping signals indicate rising crypto will retrace soon, often occurring before the reversal.
Candlestick exclusive indicators are user-friendly for all-level traders to capture a crypto top. Be aware of these alerts and take profits beforehand or wait for a better entry position.
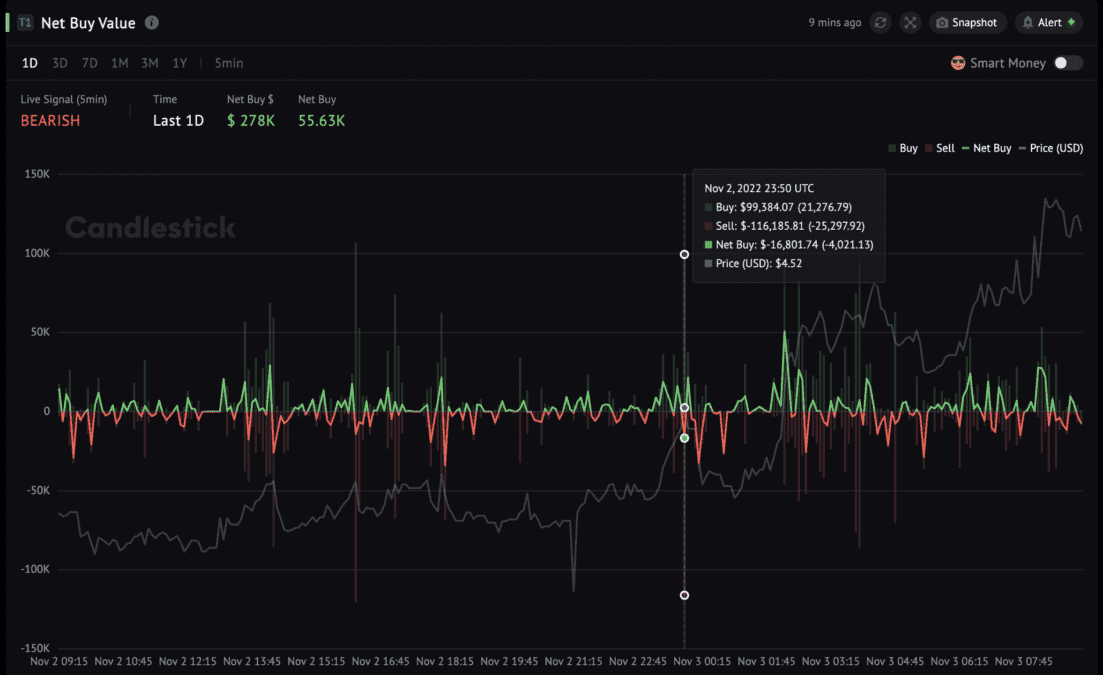
Short-Term Topping Signal: Net Buy Value + Turnover Rate
The Net Buy Value indicator reflects real-time buys and sells on decentralized exchanges. To catch a top, combine it with the Turnover Rate indicator that shows the intensity of live trading.
The rule is simple:
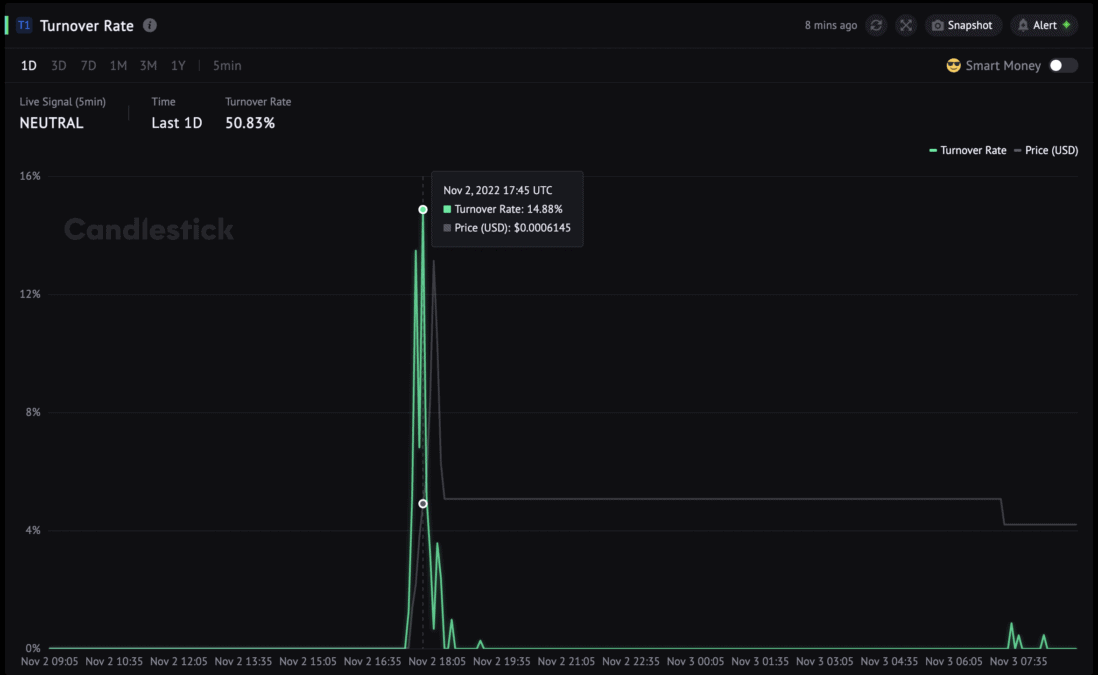
- Turnover Rate: peak
- Net Buy Value: weak or slightly negative with a large amount of sell volume
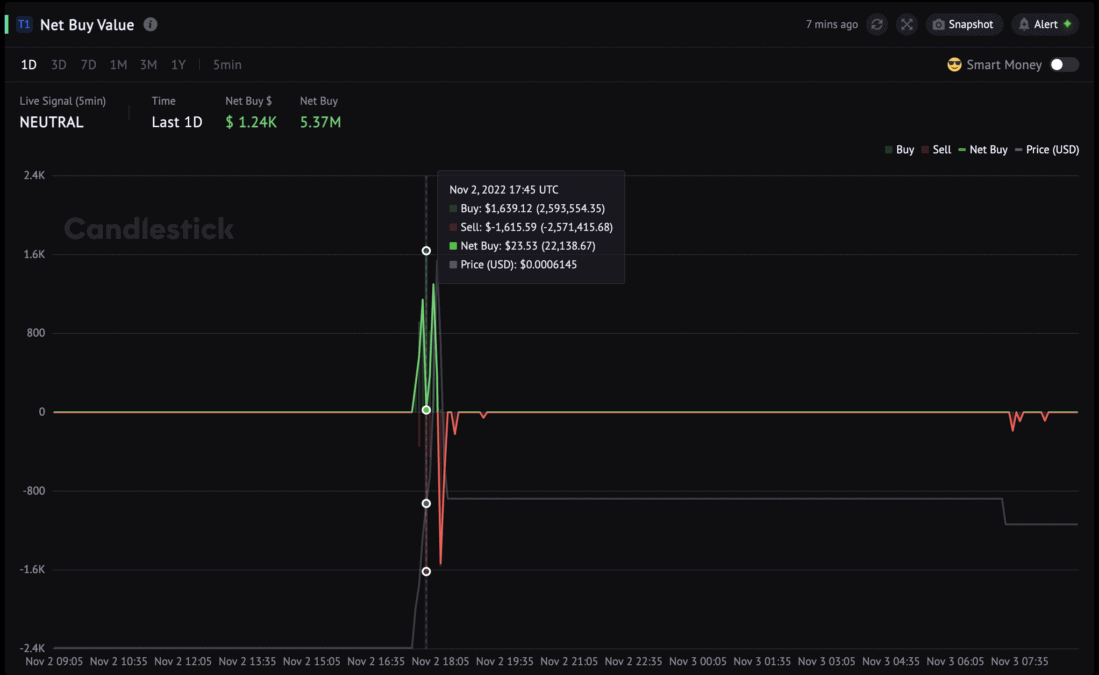
For example, switch to 5min resolution, and you can see SAKATA Turnover Rate peaked at 17:45 UTC, while Net Buy dropped to $23.53 with the largest sell value in the past 24h (the RED column)
Why? The logic is during a price uptrend:
- Net Buy is slightly negative or positive, so the price has yet to drop.
- A large sell volume with the Turnover Rate peak indicates the positions have changed from the previous holders to the new buyers at the current price.
SAKATA showed this topping signal 15 minutes before the price retraced.
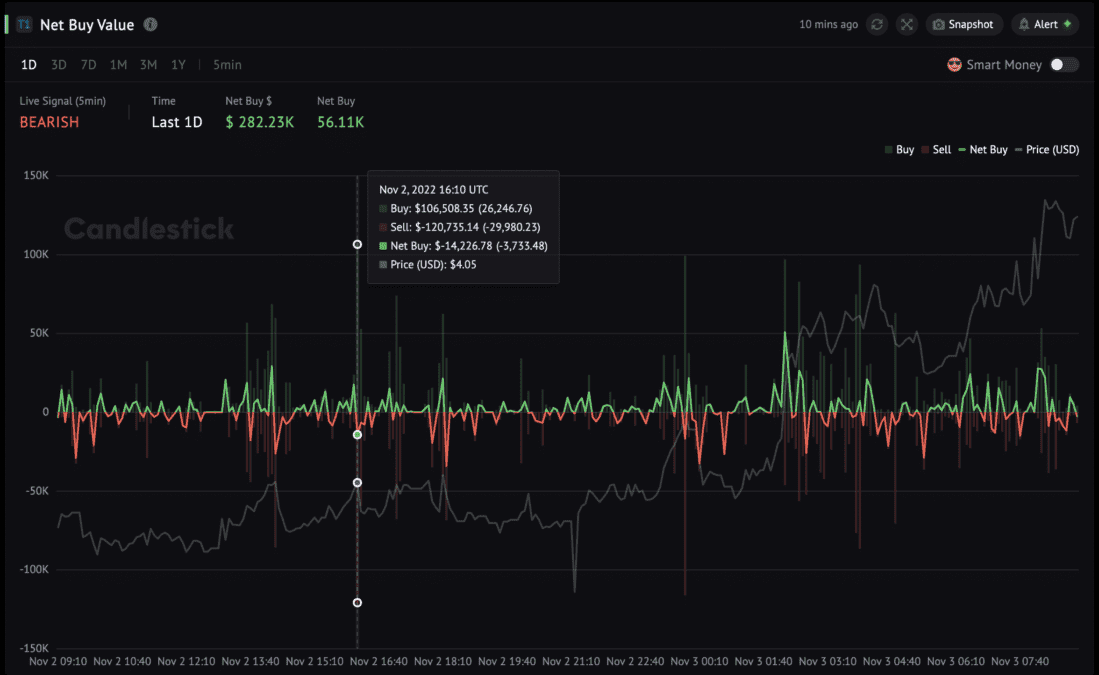
Take MASK for another example.
The Turnover Rate indicator peaked at 16:10 when the Net Buy Value turned negative. The price dropped after that.
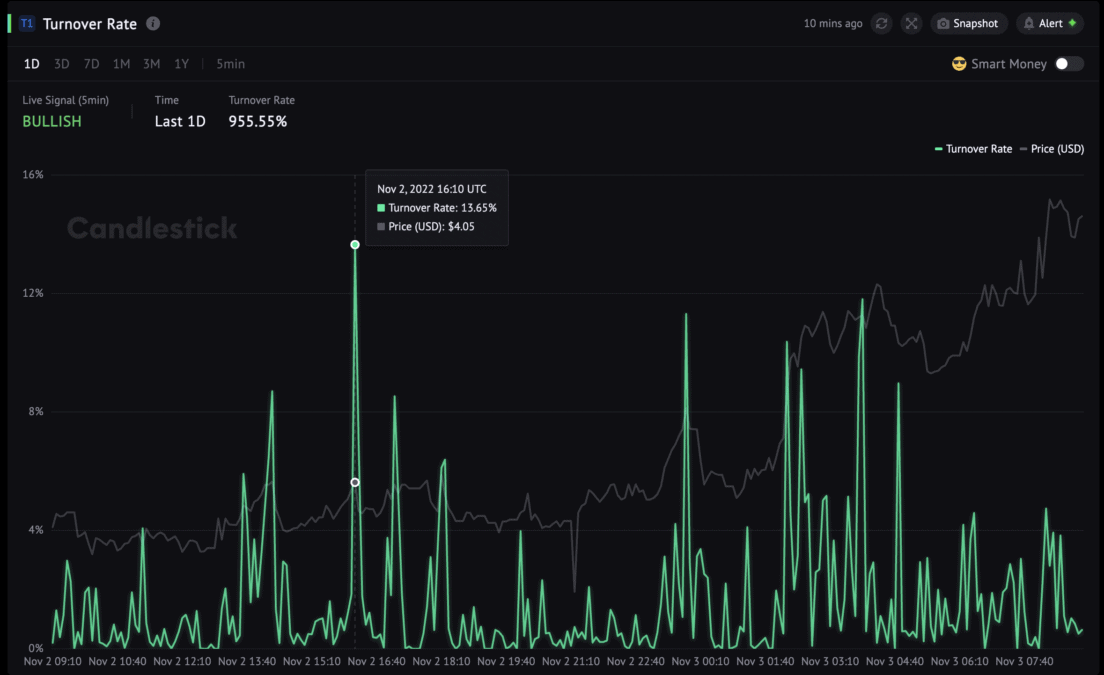
At 23:50, Turnover Rate surged again when the Net Buy Value was red. The reversal occurred 5 mins later.
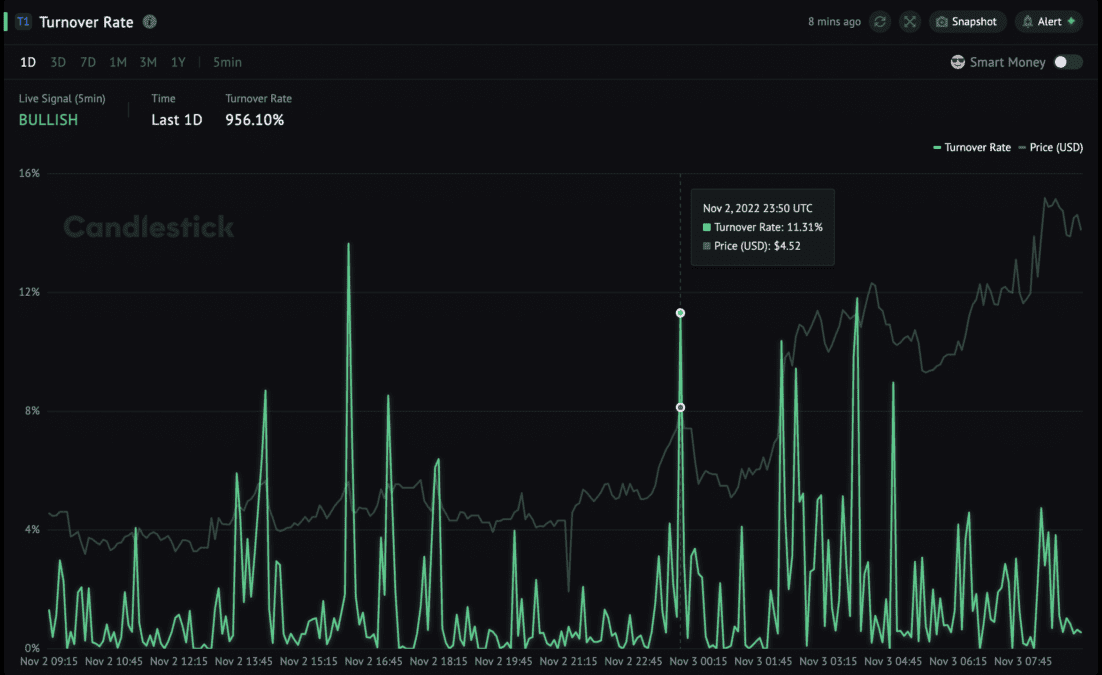
Data proved that you could have 5 to 15 minutes to act before the fall by applying this method.
Metrics For Real-Time Buy/Sell
Long-Term Topping Signal: CEX Deposits + Liquidity Removal
Large amounts of crypto flowing to centralized exchange or significant Liquidity removed profoundly impact the price and even cause a long-term retrace.
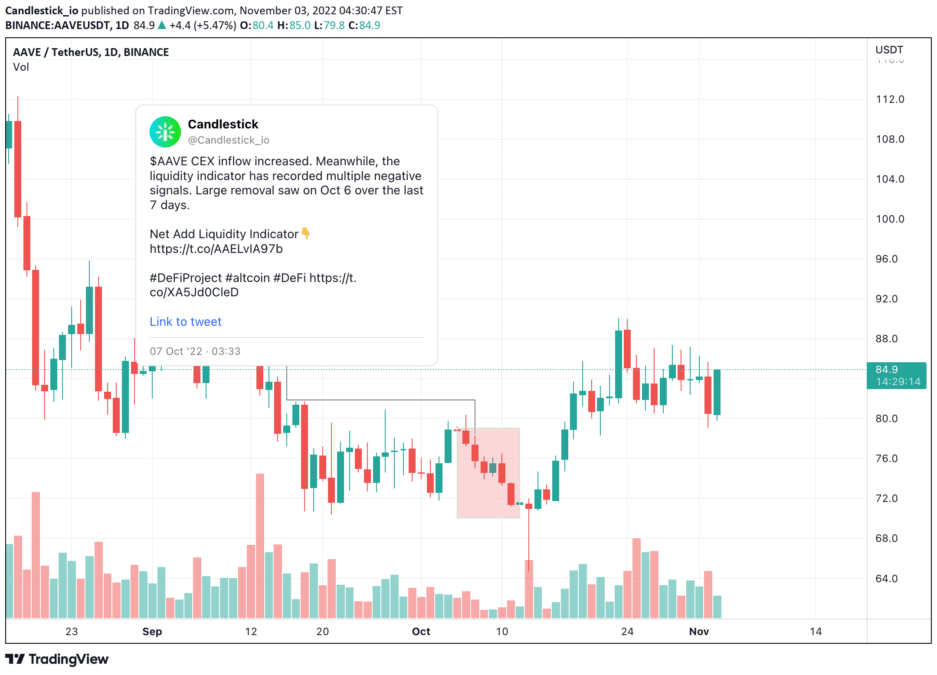
For example, on Oct 7, we detected that AAVE CEX inflow increased. Meanwhile, the liquidity indicator recorded multiple negative signals – Large removal had occurred since Oct 6.
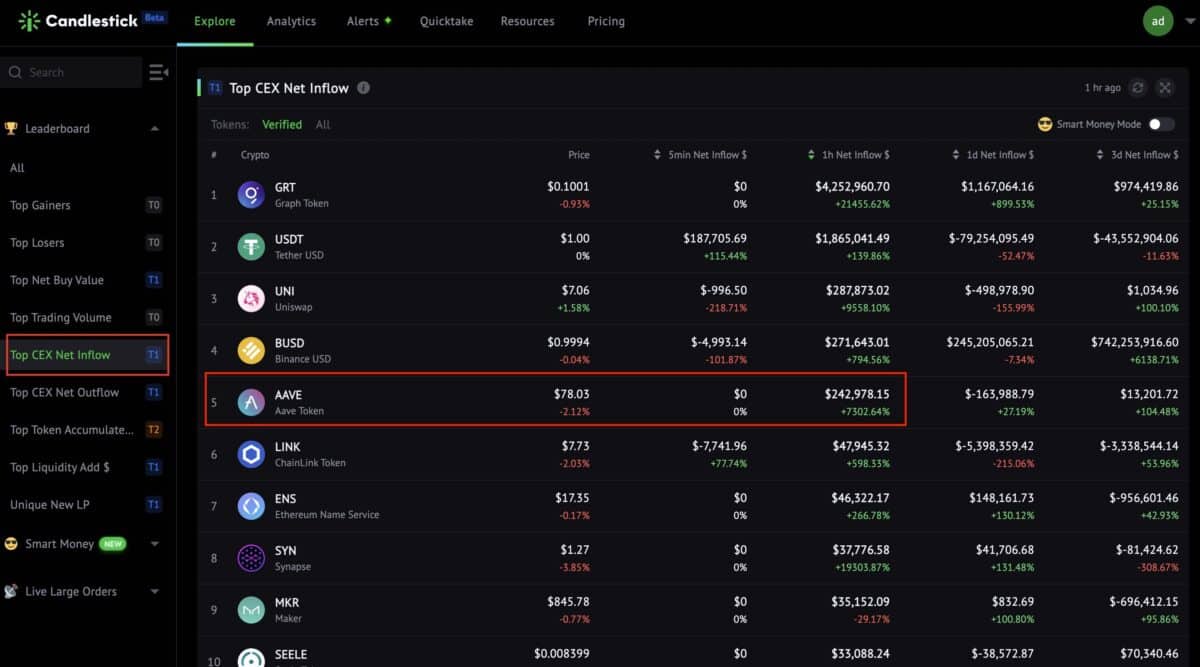
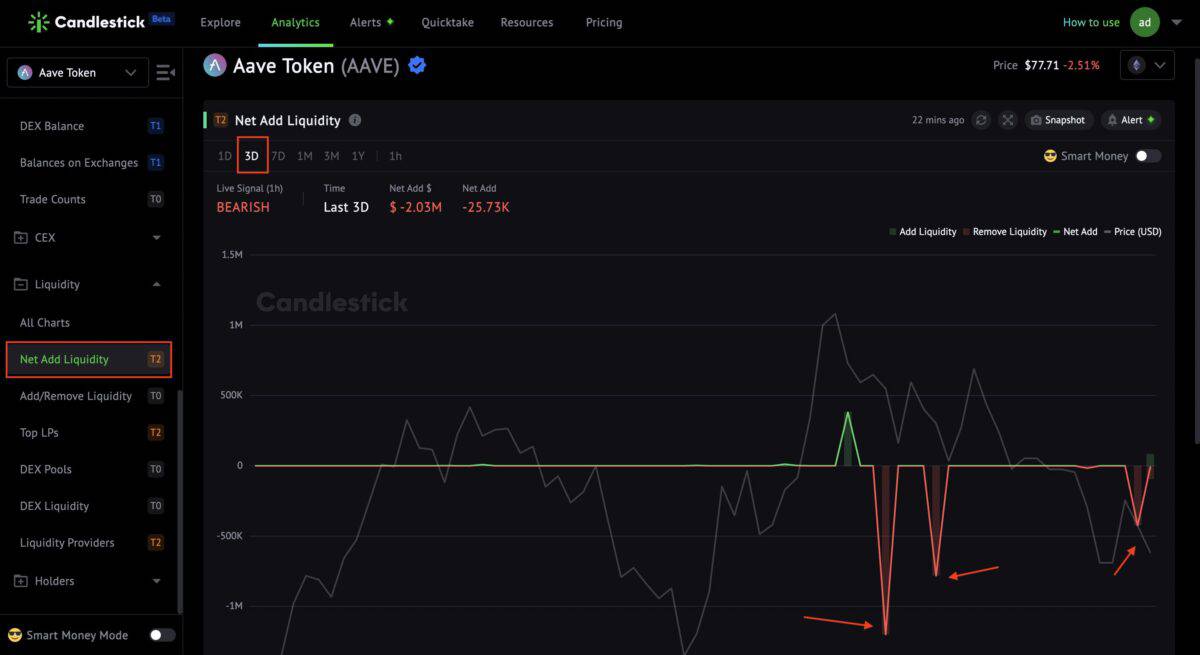
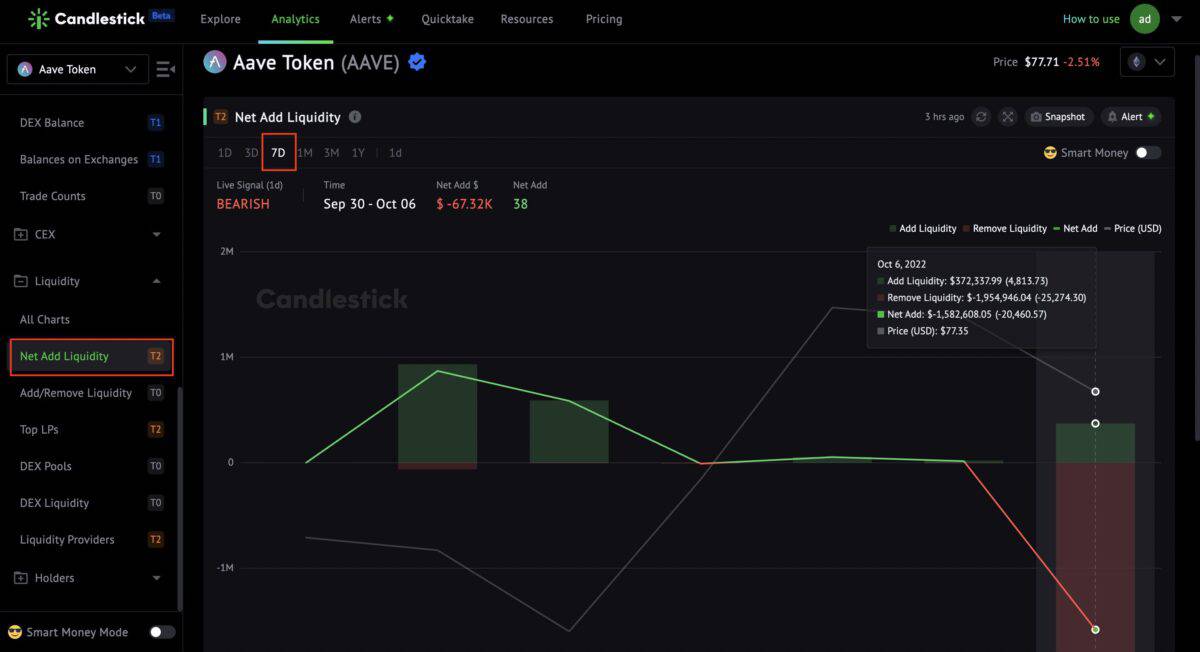
The price entered a downtrend in the next seven days.
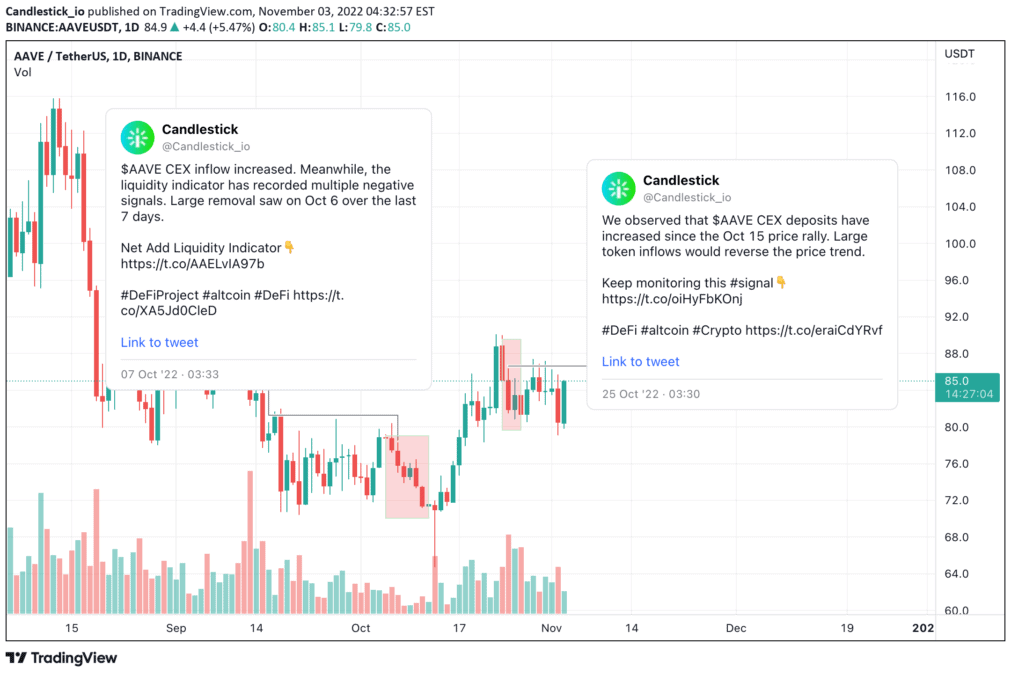
Likewise, AAVE CEX deposits had continually increased from Oct 15 price rally to Oct 24.
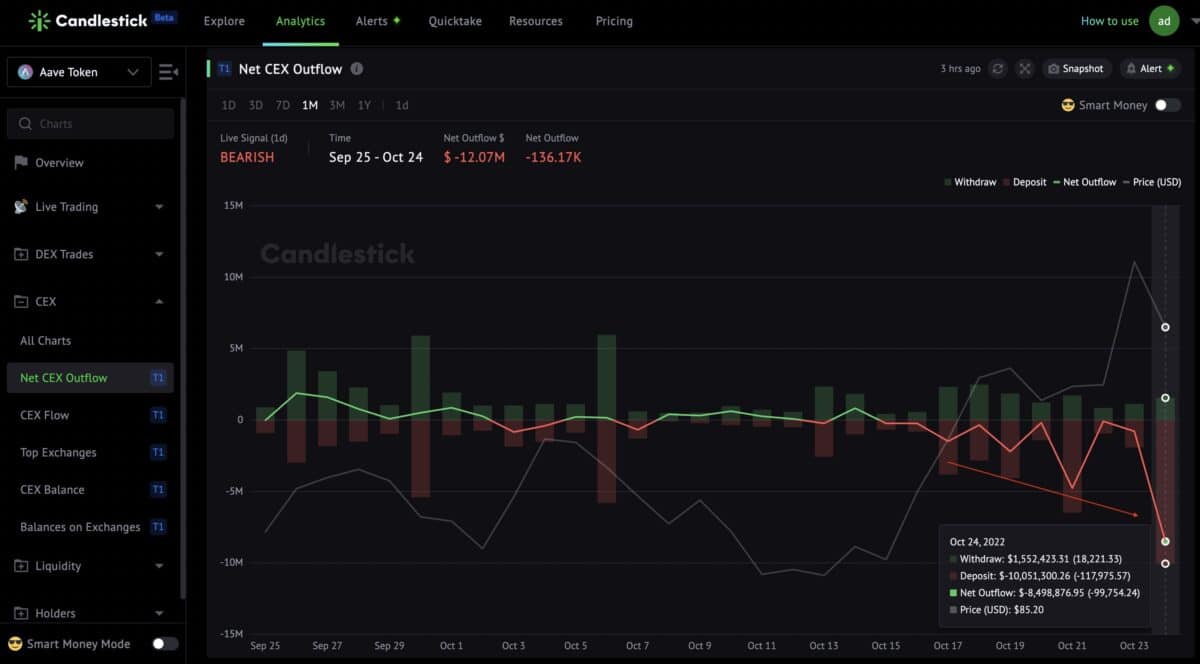
The retrace started on Oct 24, when the most significant negative peak was recorded.
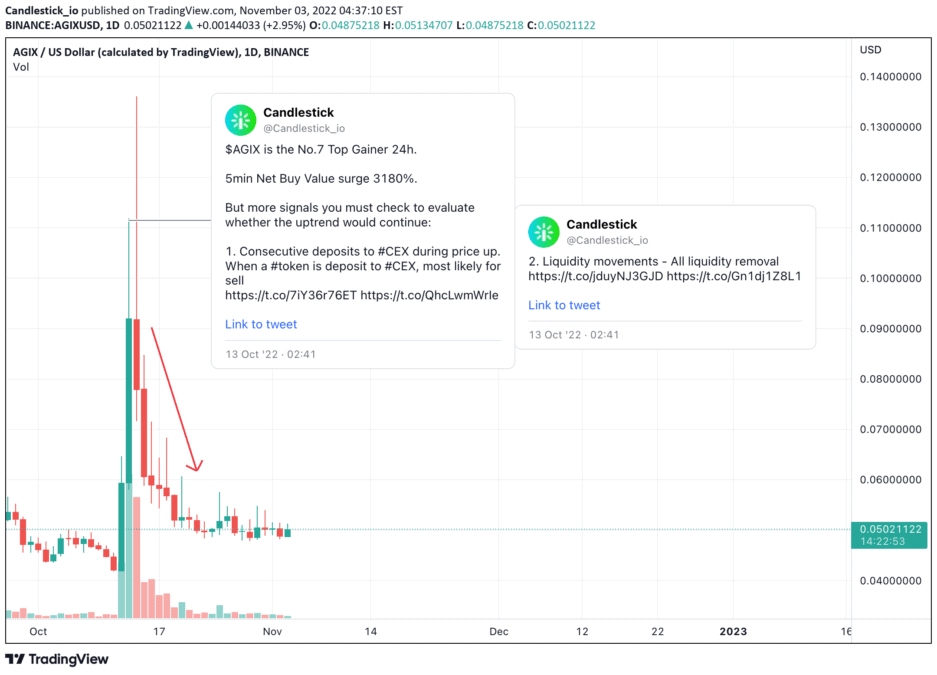
AGIX is another proven case. on Oct 13, the increase in CEX deposits combined with the removal of Liquidity suggested that the price reached the top.
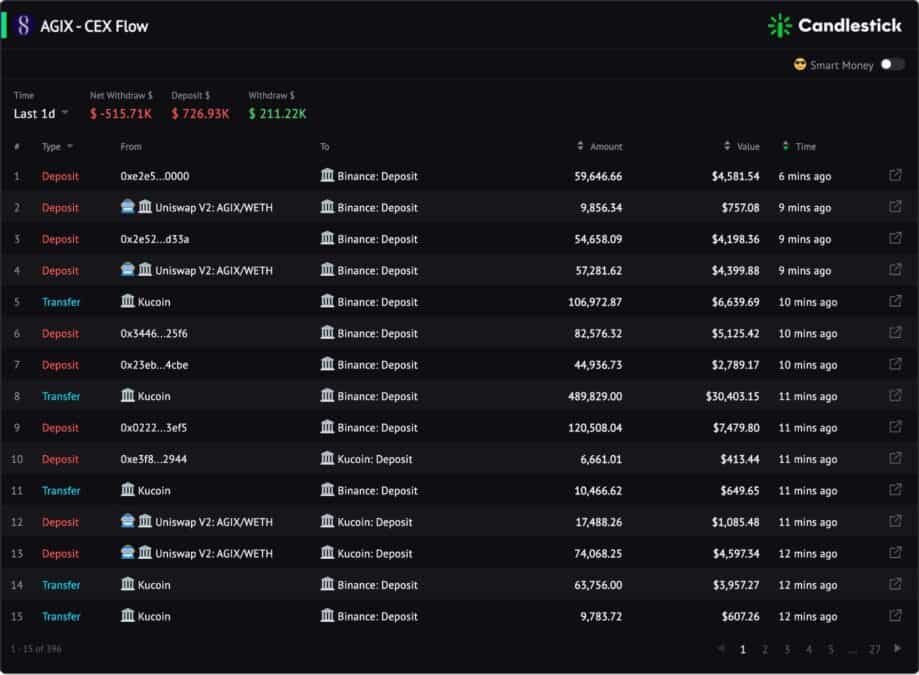
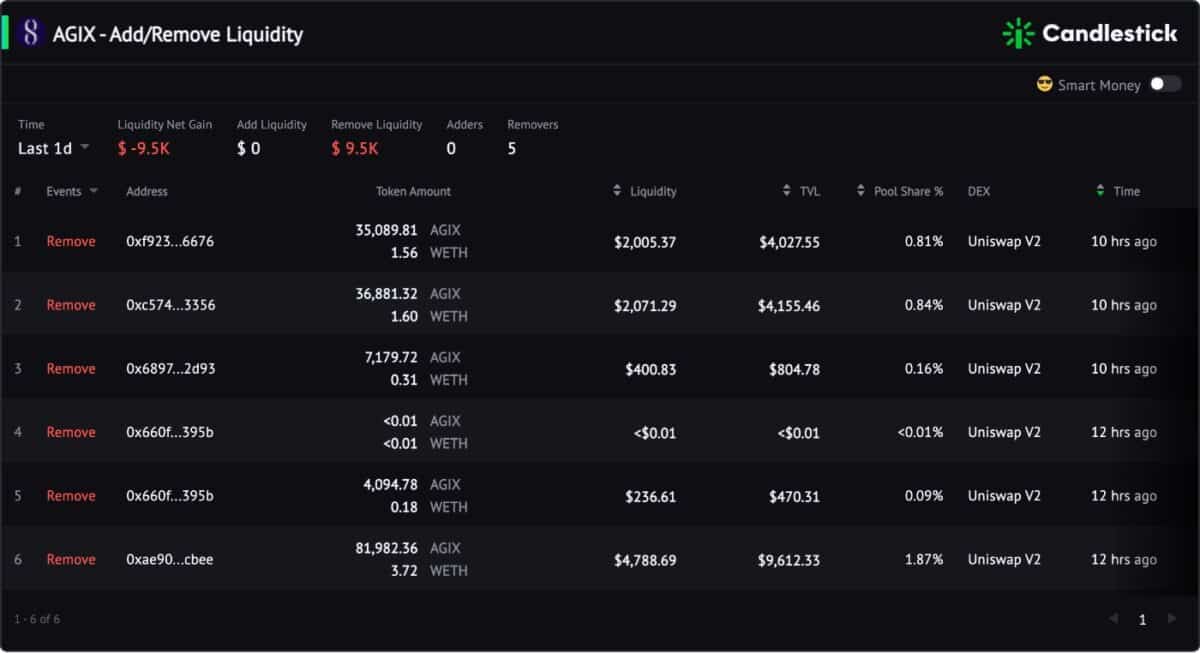
The reversal happened overnight.
Metrics to Monitor CEX Flow & Liquidity
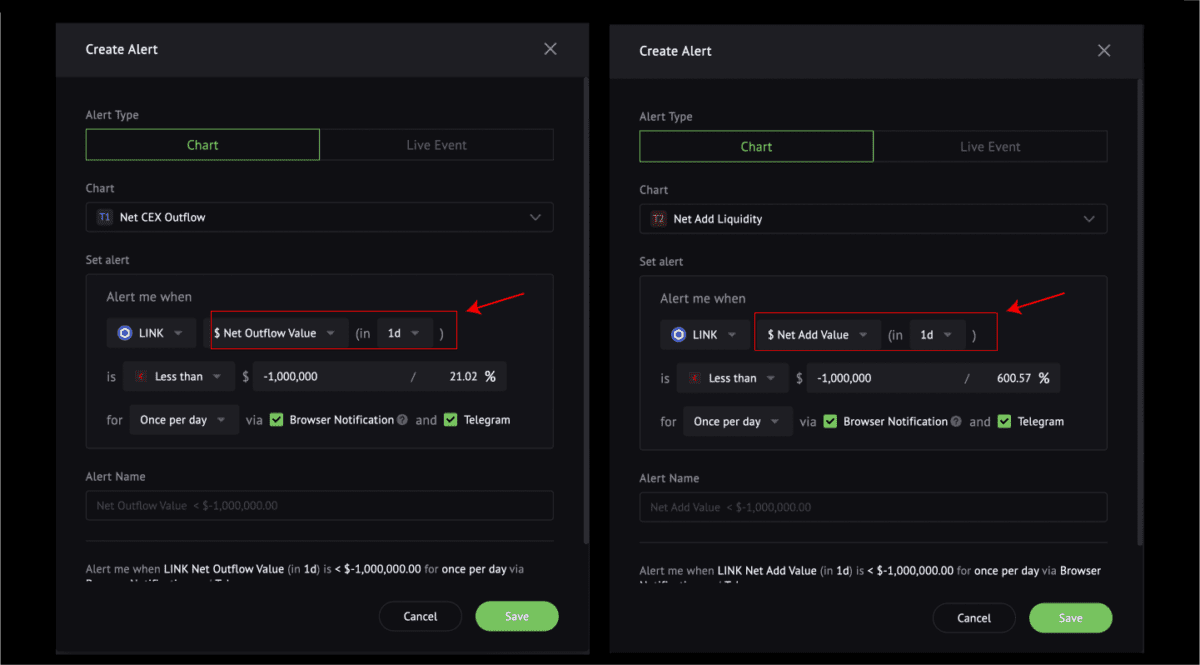
Set Up "Alerts" For Topping Signals
Candlestick offers a custom alerts function in all indicators. So, you can monitor price tops based on different charts.
For example, track Net Buy Value and Turnover Rate changes in 5 min resolution to capture short-term crypto tops.
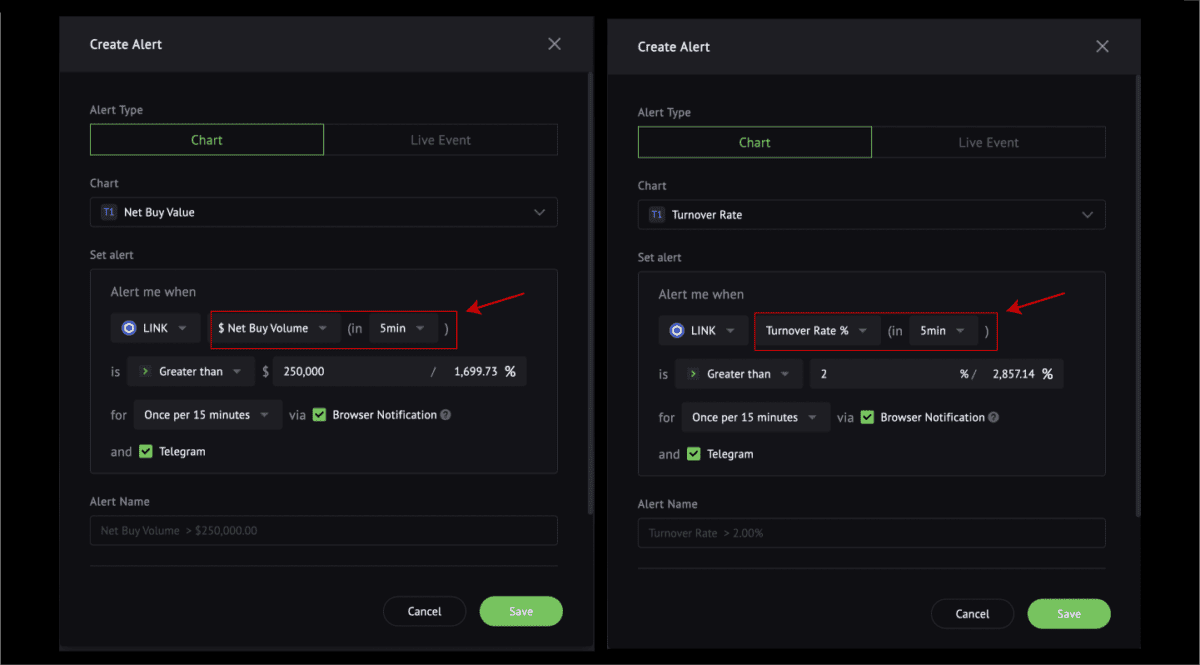
Meanwhile, setting up alerts of Net Add Liquidity and Net CEX Outflow indicators in 1d resolution for long-term tops.