Quicktake
- Divergence in Net Buy Value & Price indicates entry and exit timing.
- Track trends according to Net CEX Outflow or Net Add Liquidity divergence signals.
What is Divergence?
Divergence is when the price moves contrary to trading indicators. In general, it warns of upcoming price direction changes.
On Candlestick, we’ve observed three types of divergences indicating reversals.
- Net Buy Value & Price
- Net CEX Outflow & Price
- Net Add Liquidity & Price
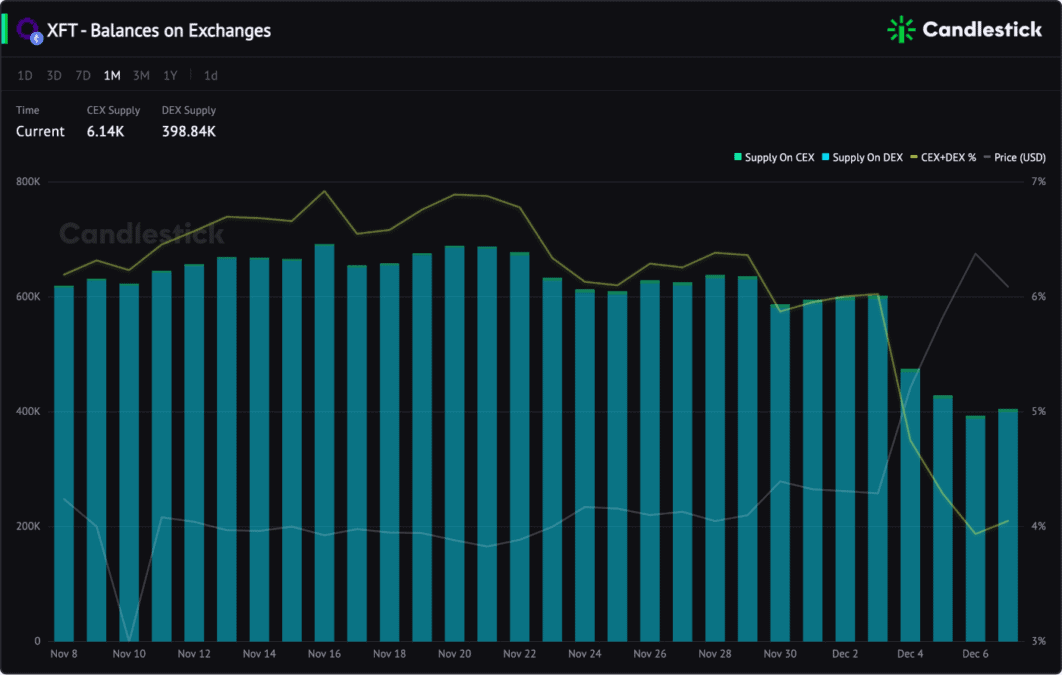
Before you trade, check the Balances on Exchanges or Top Exchanges charts to understand the distribution of the token supply. Then choose the most related indicators to find divergence signals.
For example, most XFT tokens are circulating on decentralized exchanges, so the Net Buy Value and Net Add Liquidity indicators are more sensitive to the price than the Net CEX Outflow.
Divergence In Net Buy Value & Price
Net Buy Value is a real-time indicator to alert you of price rises or falls.
When Net Buy Value moves in the opposite direction of the price, a divergence signal indicates the price may change direction. Therefore, you can capture this signal to decide entry and exit timing.
The rule is simple:
- Entry: Net Buy Value goes up & the price drops
- Exit: Net Buy Value drops & the price goes up
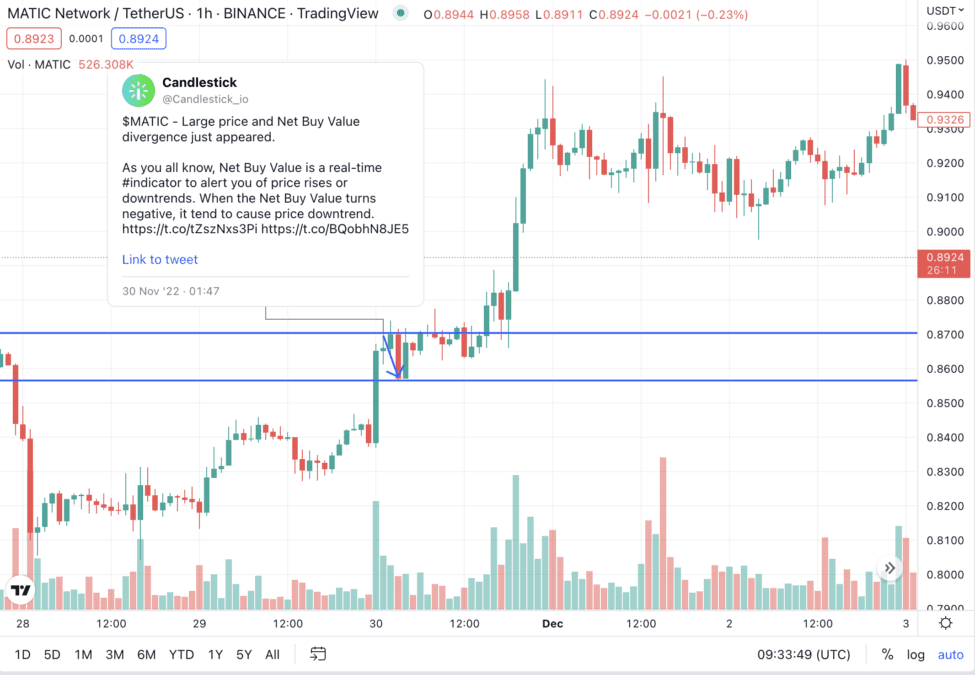
Here is a Sell-On-Rise example.
On Nov 30, we observed a divergence in the MATIC Net Buy Value indicator when the price was climbing fast. It was a negative signal indicating the selling pressure was strong, and the buying power was too less to support a higher price.
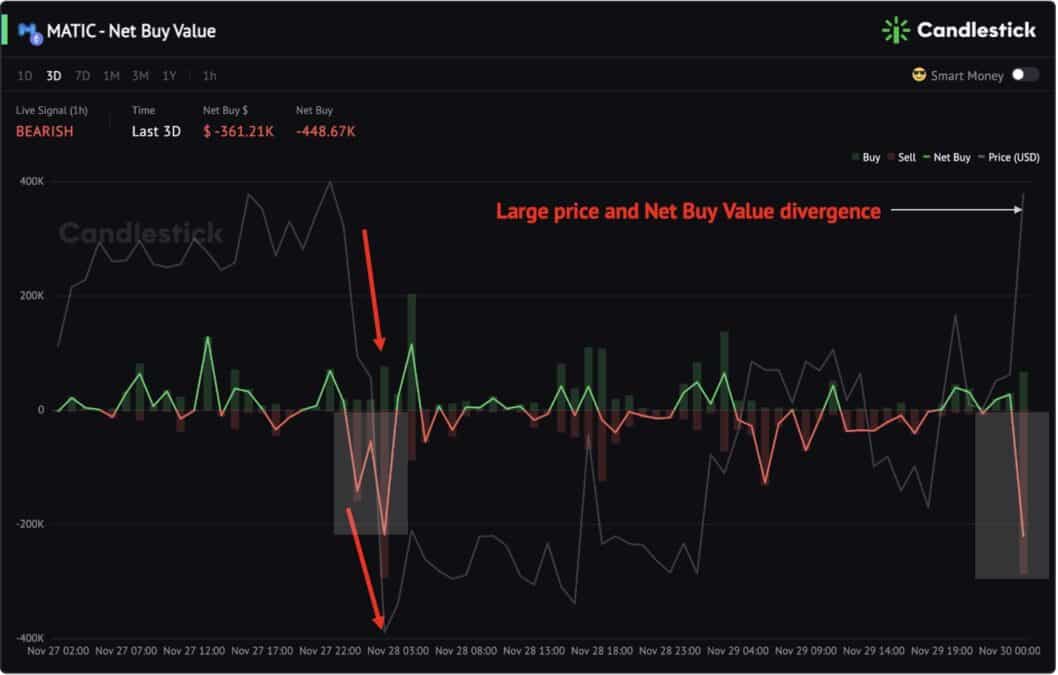
Data proved that the price experienced a short-term correction an hour later. So if you are a swing trader, this signal would help you sell on top and re-buy on the dip.
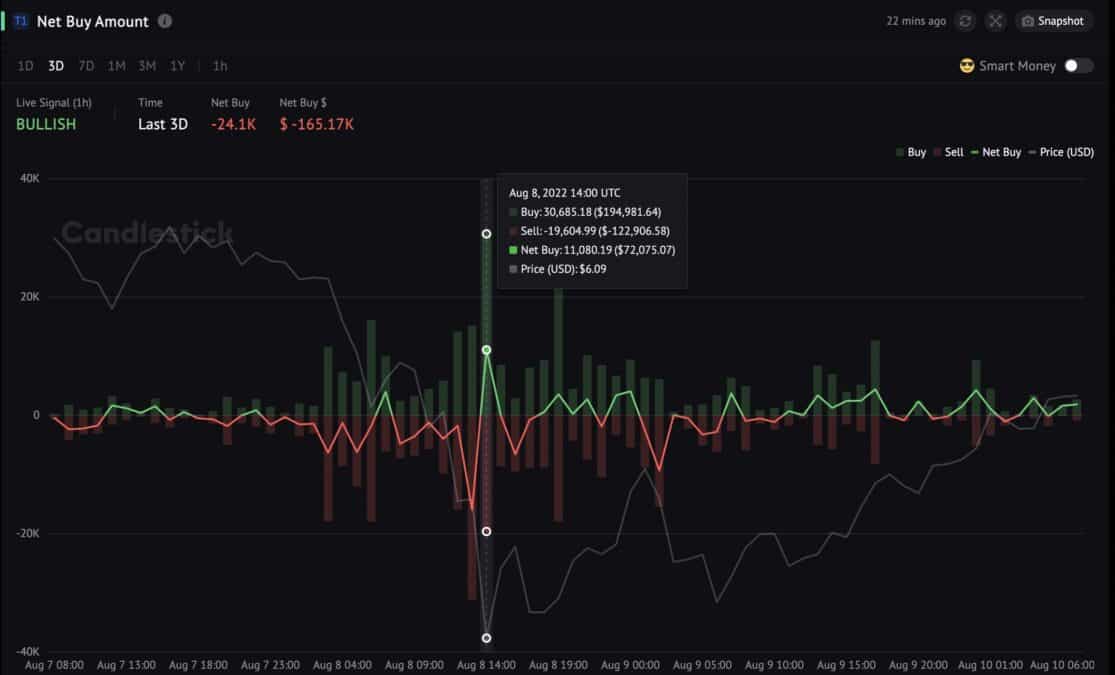
Likewise, there is a Buy-The-Dip case.
On Aug 10, the PLSD chart indicated a clear divergence at 14:00 when the price dropped to $6.09 with a surge in Net Buy Value. You would get a day uptrend if you captured this signal.
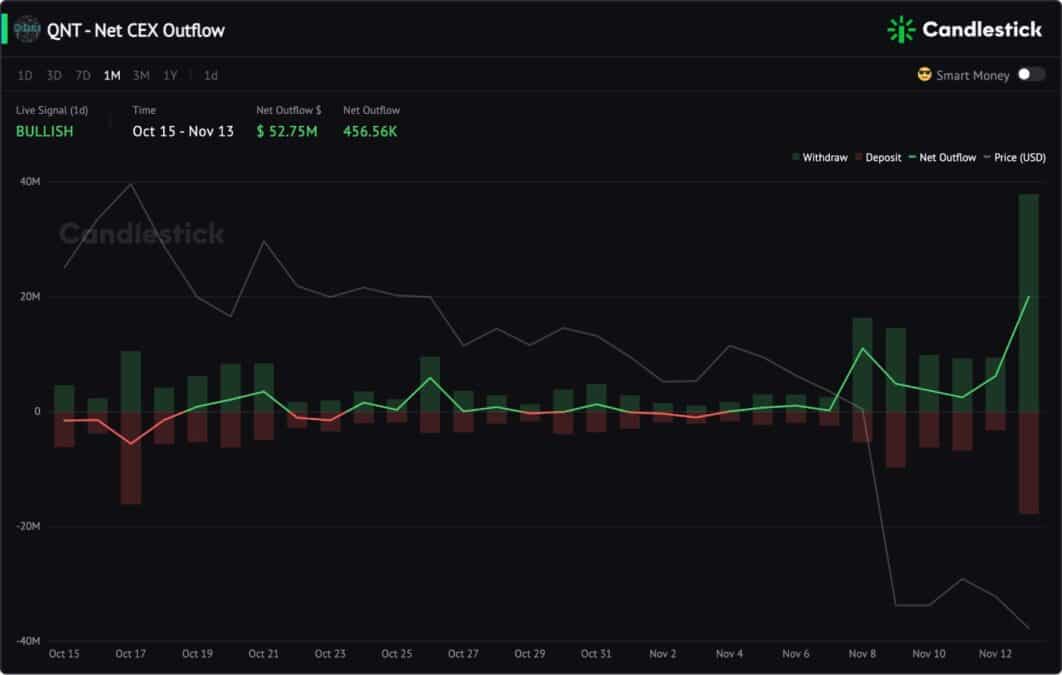
Divergence In Net CEX Outflow & Price
The Net CEX Outflow reflects tokens flowing in and out of centralized exchanges. When this signal diverges, price changes occur after a while because inflows and outflows do not immediately lead to selling and buying.
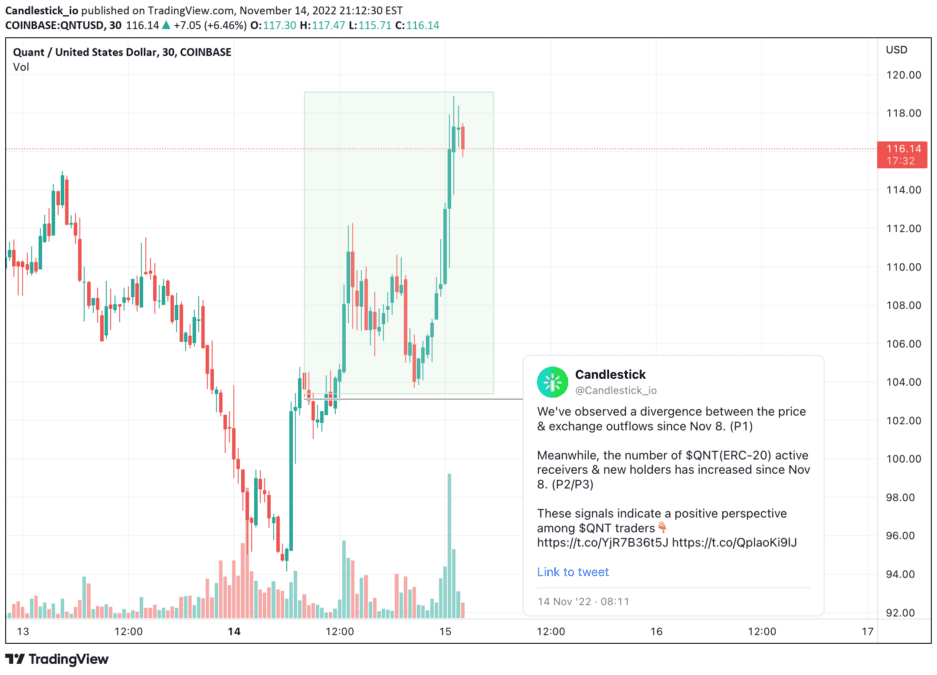
For example, on Nov 14, we observed that the divergence signals between the QNT (ERC-20) price & exchange outflows started from Nov 8 and continued for a few days.
Meanwhile, the number of QNT active receivers & new holders also started to increase since Nov 8.
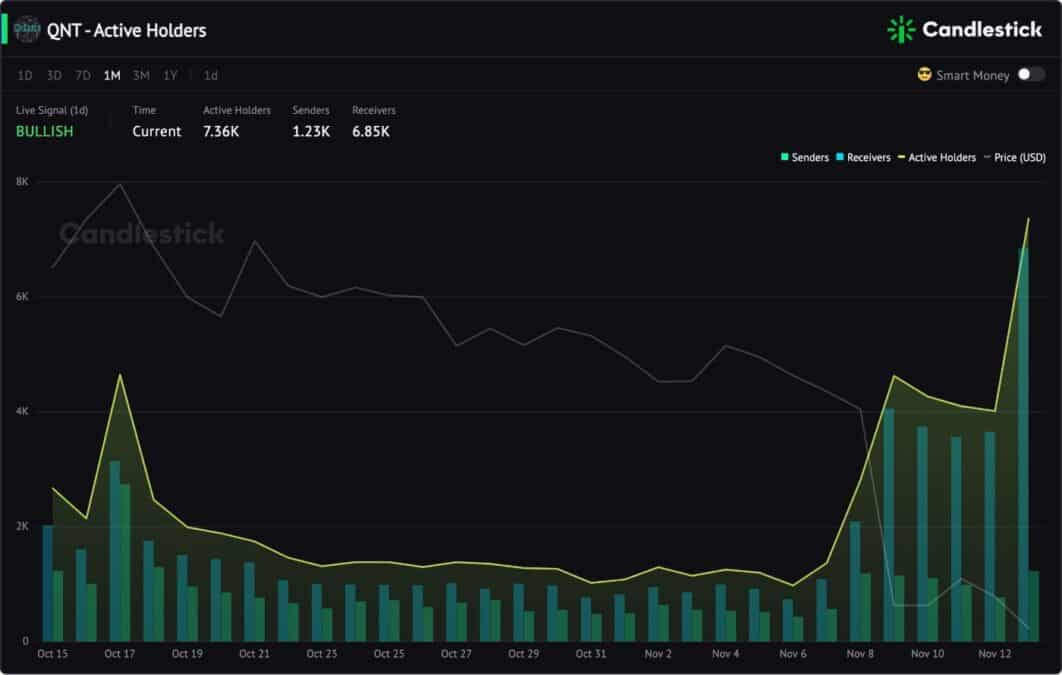
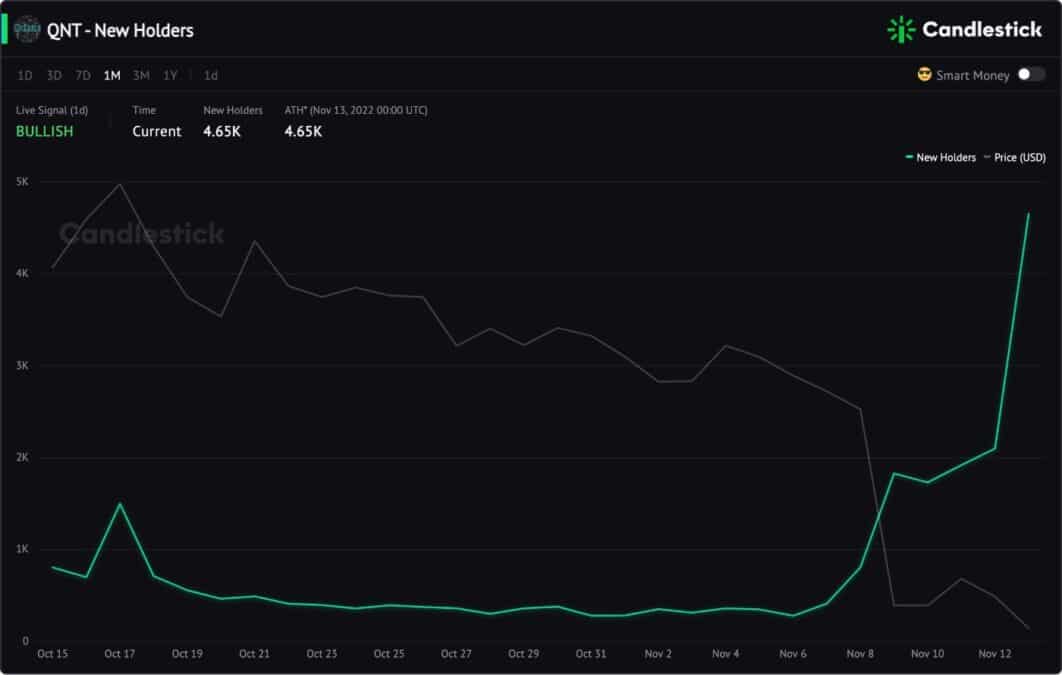
Combining these divergence signals, we concluded that traders buy tokens on CEXs and transfer them to on-chain wallets, which is a positive signal indicating accumulation.
QNT pumped 21.72% after the most significant divergence appeared. Then, and till now, the price has rebounded from $102 to $118.
Divergence In Net Add Liquidity & Price
Net Add Liquidity indicates the actions of liquidity providers. Divergence in this chart expresses that LPs add liquidity during price downtrends or remove assets when prices boost.
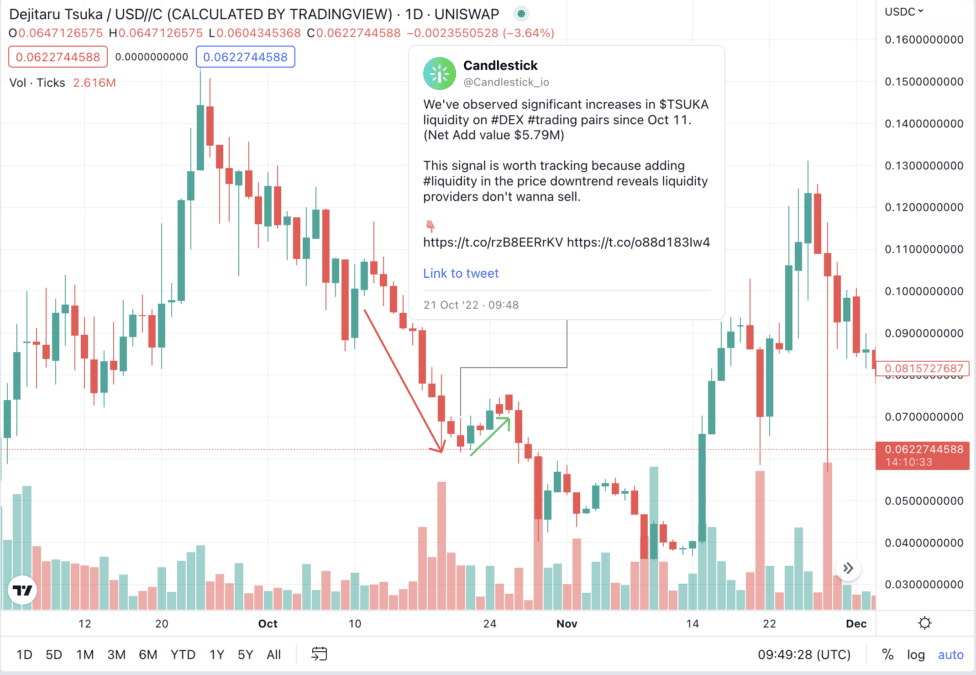
For example, on Oct 21, We observed significant increases in TSUKA liquidity on DEX trading pairs within ten days. Adding liquidity in the price downtrend reveals liquidity providers don’t want to sell.
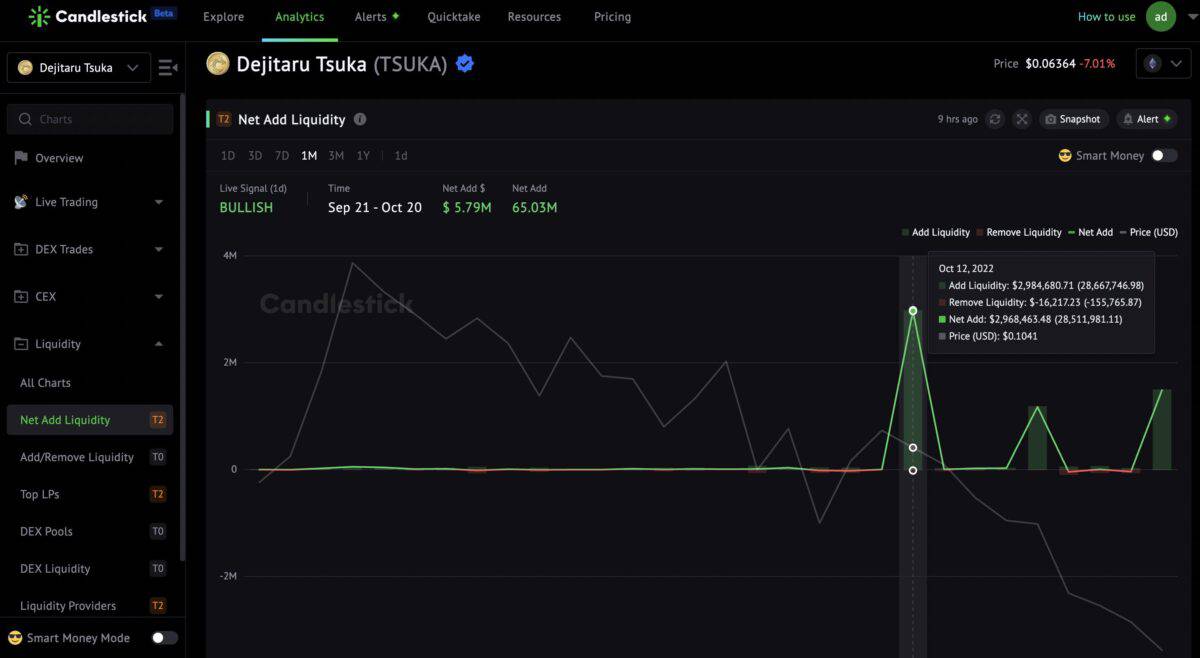
Data proved that Oct 21 was a turning point leading to a five-day price rally.