If your crypto trading style is kinda “long-term”, Liquidity is one of the key factors for finding “long-term” investment targets.
Liquidity Add/Remove reflects holders’ long-term perspective of a token’s price.
- Add Liquidity: LPs put tokens into the trading pairs because they believe more traders will trade with this token and generate trading fees. It is an optimistic action as these added tokens are transferred to the DEXs.
- Remove Liquidity: LPs remove tokens from the trading pairs and give up future rewards, most likely for selling.
Candlestick tracks 8 signals of liquidity data.
Token Liquidity Indicators
- Net Add Liquidity (with Smart Money Mode)
- Top LPs (with Smart Money Mode)
- DEX Liquidity
- Liquidity Providers (with Smart Money Mode)
- Live Trading – Add/Remove Liquidity (with Smart Money Mode)
Explore Page Features
- Top liquidity Add $ (with Smart Money Mode)
- Unique New LP (with Smart Money Mode)
- Live Trading: Large Orders in 24h (with Smart Money Mode)
There are 2 steps for you to find the “long-term” investment targets and analyze the trend.
Step 1: 3-Day Top Liquidity Added Tokens
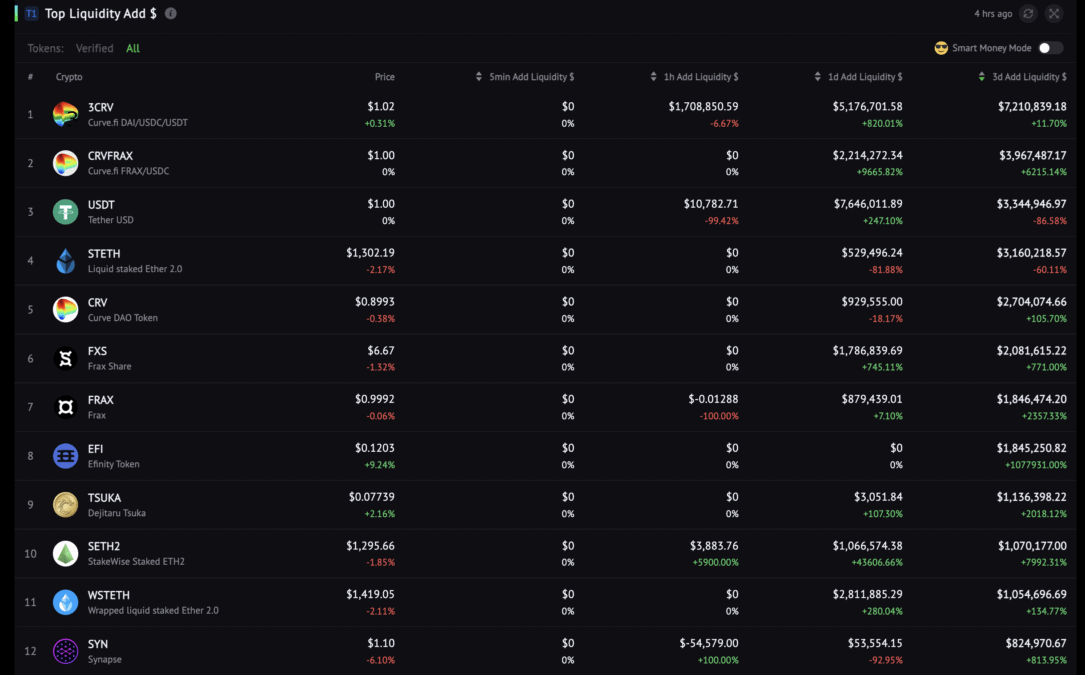
This Top Liquidity Add $ list ranks tokens by Net Add Liquidity Value $. (Net Add Liquidity = Liquidity Added – Liquidity Removed)
We are looking for longer-term investment targets, hence, sort by 3d Add Liquidity $ to see the top token ranking.
Step 2: Analyze The Liquidity Movements During Price Uptrends And Downtrends
Continuous positive Net Liquidity Add can lead to a price reversal during a price downtrend.
During a price uptrend, positive Net Liquidity Add can be viewed as a signal that the price uptrend tends to continue.
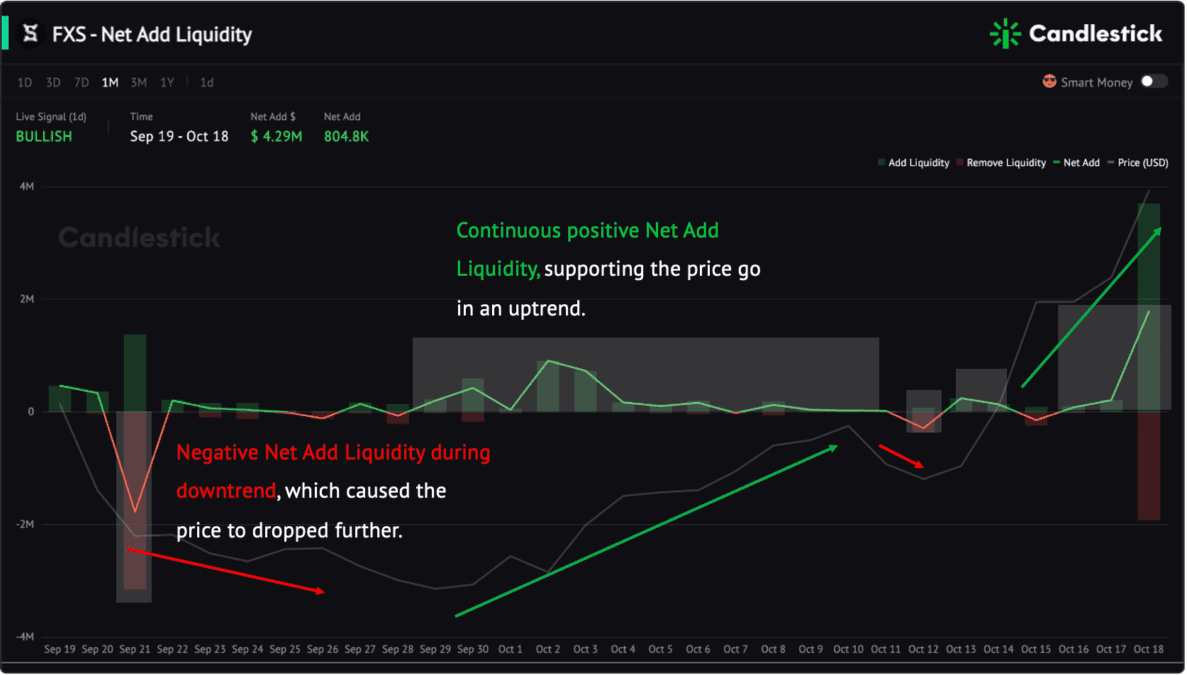
Take $FXS as an example.
The chart above clearly reflects how the Net Add Liquidity will reflect on the token price. When the Net Add Liquidity sees GREEN for the continuous 2 weeks from Sep 29 to Oct 10, the price is in a steady uptrend.
Let’s check another token in the list $SYN.
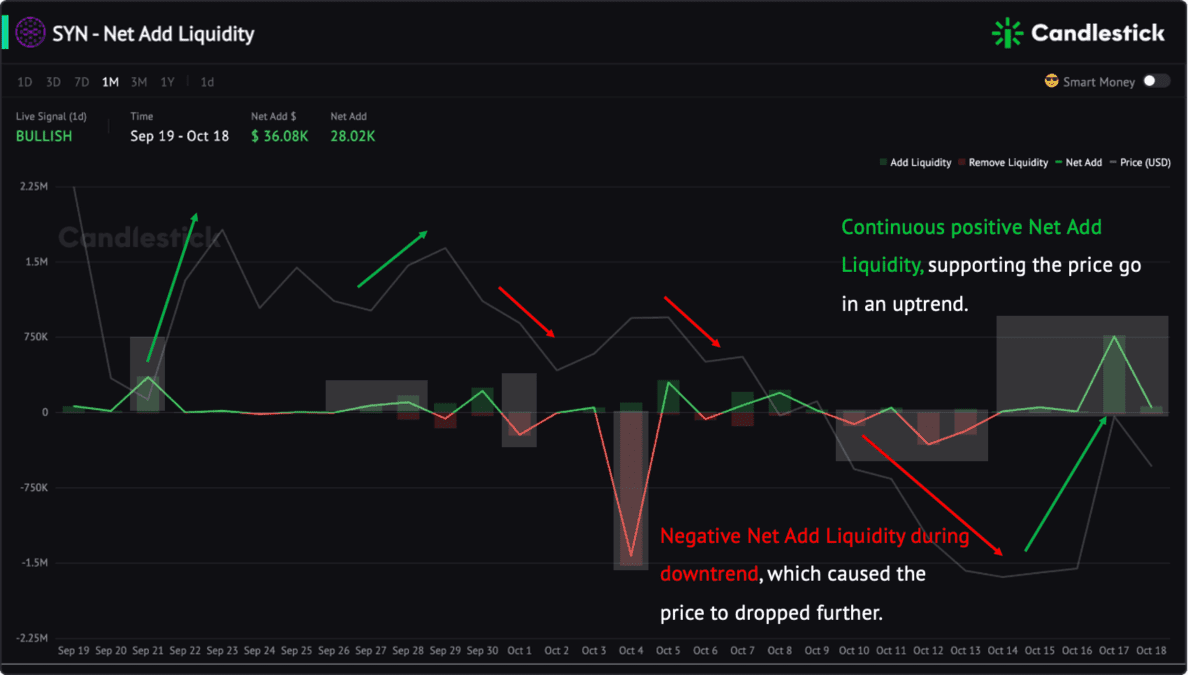
Continuous positive Net Add Liquidity will support the price in the uptrend. While continuous negative Net Add Liquidity will cause the price to drop further.
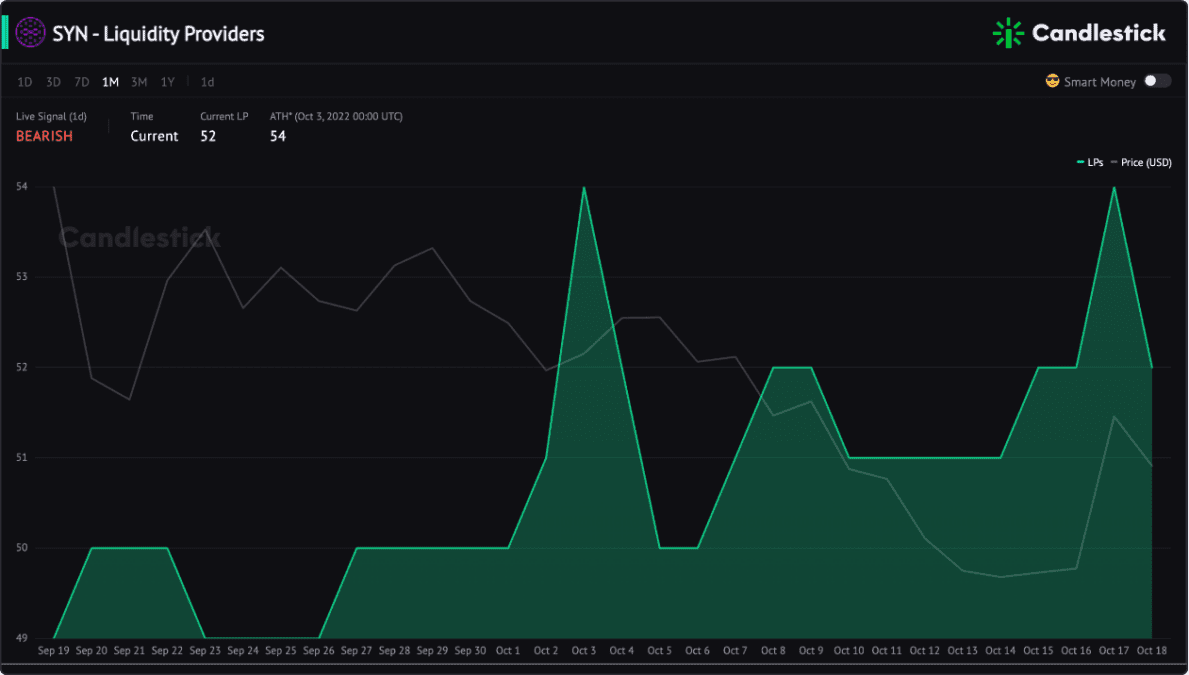
Liquidity Providers number is going up as well.