AAVE - Exit at a higher price by Net Buy Amount indicator
AAVE +16.97% 24h. Again, you can use the Net Buy Amount indicator to capture a better exit price than others.
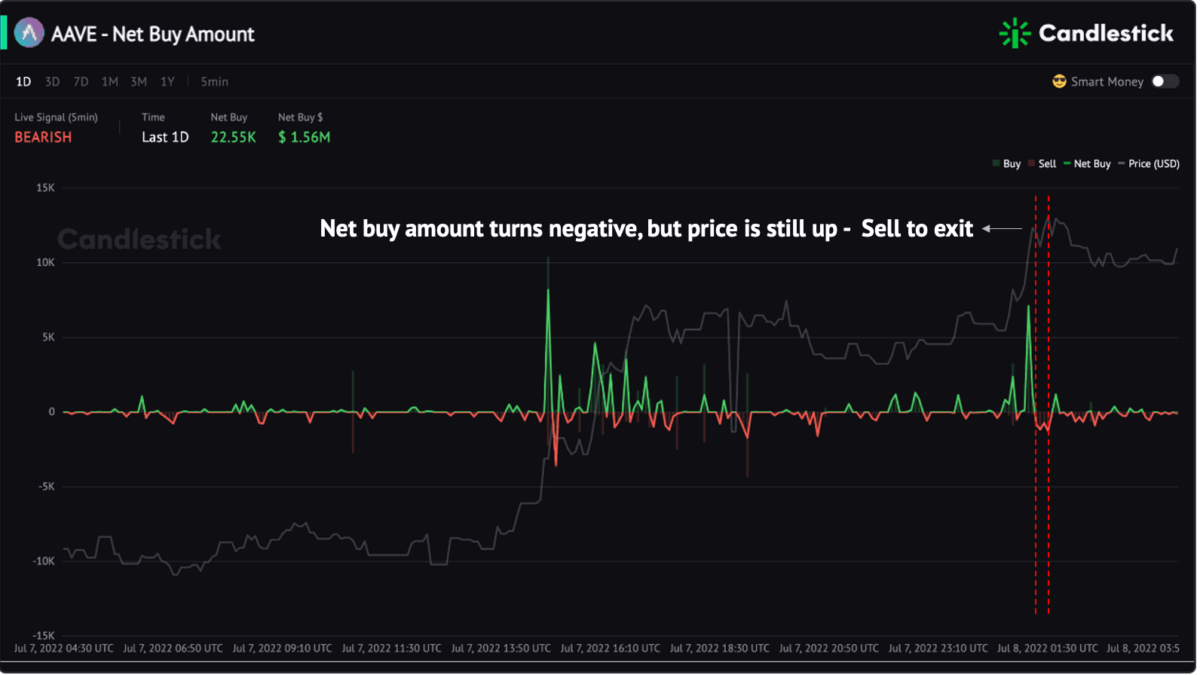
When the AAVE price went up to $73.68 with the Net Buy Amount peaks, in the following 25mins, the Net Buy Amount drops to negative, but the price still increases to $74.97.
The Net Buy Amount & token price divergence appears – Net Buy turns negative, but the price is increasing — Sell to exit.
The Net Buy Amount is an exclusive token metric on Candlestick. If you still don’t know how to use Net Buy Amount & token price divergence to capture a buy/sell timing, make sure you learn it now!
LOOKS - Monitor Liquidity Changes
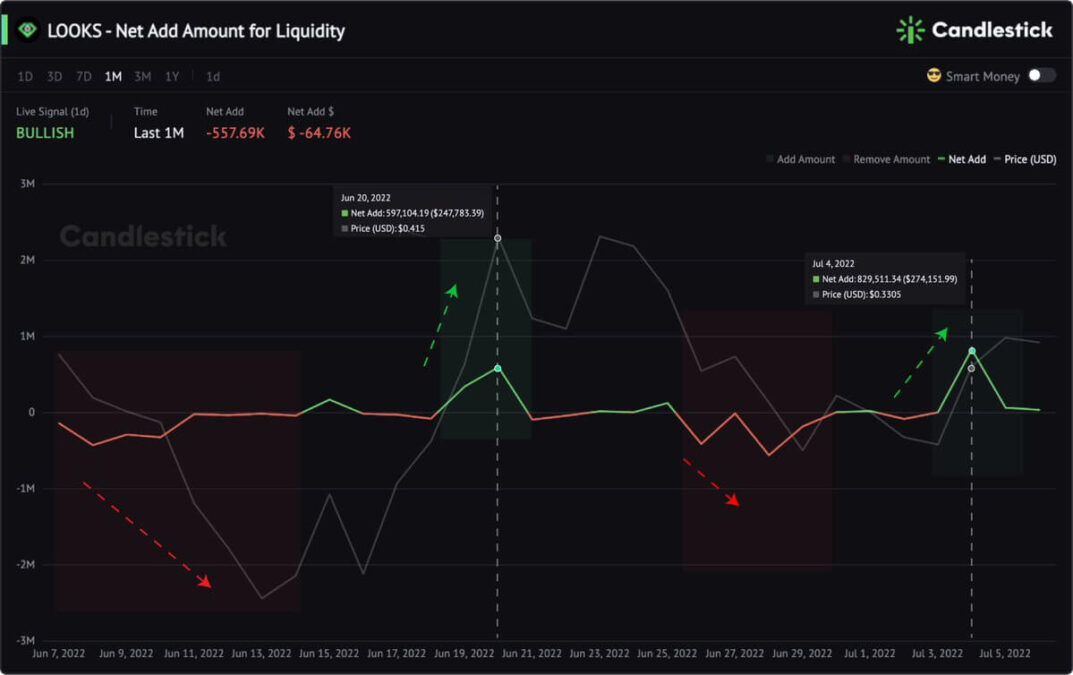
LOOKS Net Add Amount for Liquidity Indicator correlates with the price. When the indicator is negative (turns red), the price falls. When the Liquidity Net Add Amount peaks, there is an uptrend in price.
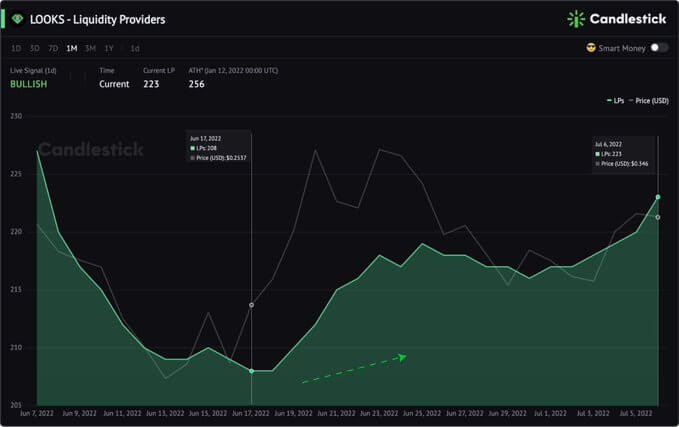
LOOKS Liquidity Providers number is another indicator to understand the long-term price trend of LOOKS.
If the Liquidity Net Add Amount remains positive and the Liquidity Providers number increases, the LOOKS price uptrend can be validated.
1INCH - 2 Obvious Long-term Bearish Signals
1INCH +10% 24h. The short-term signal of 5-min Net Buy Amount surges 144616% & 648% at 02:45 UTC0 and 06:40 UTC0 respectively, pushing the price up.
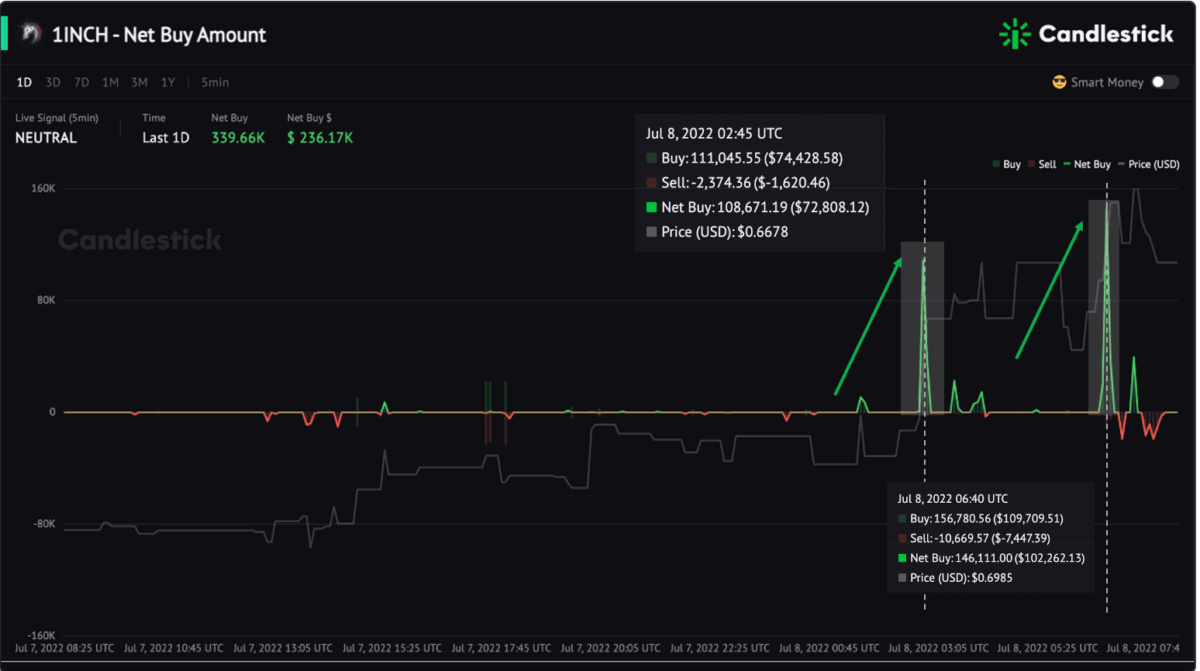
However, looking at the long-term, it is not so positive.
Click to change to 7D and check the movement of the Net Buy Amount indicator.
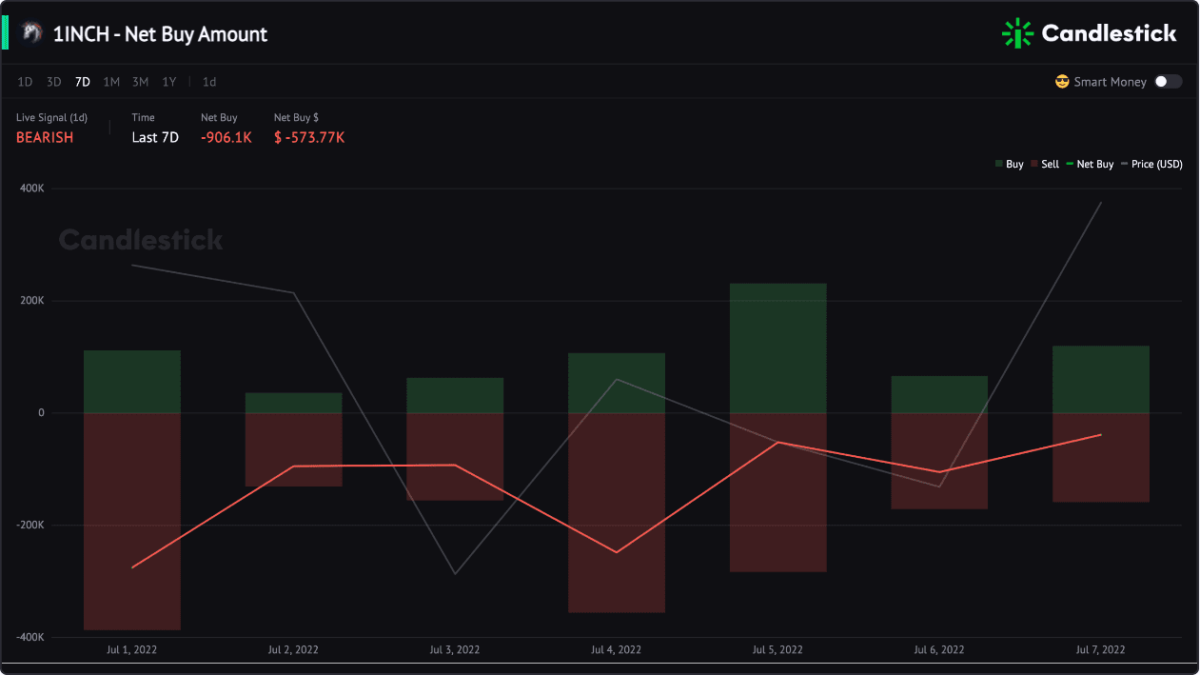
The 1INCH Net Buy Amount stays negative (in red) for the past 7 days and has no signs of turning positive yet.
The special offer for early supporters ends in 6 days - Save $110
Don’t miss it!