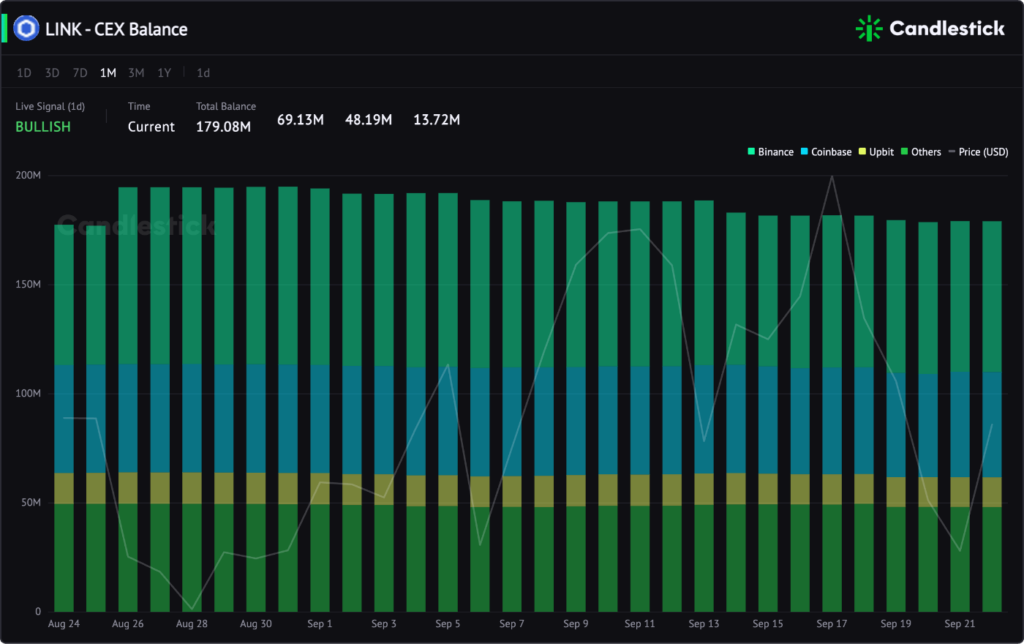
This article introduces the CEX Balance metric and how to use it to track market trends.
Definition
The CEX Balance chart shows the sum of the circulating supply of a particular token in 10+ centralized exchanges (CEXs) and the respective supply of the first 3 CEXs.

For instance, suppose a sum of 100,000 examplecoins are circulating in the market, and 20,000 of them are circulating on centralized exchanges based on Candlestick data tracked. In this case, the CEX Balance figure will be 20,000(20%).
How can I use it?
The changes in this metric can indicate the possibility of sell or buy actions in the market of a particular token.
Identify bullish and bearish signals
A trader’s sending and receiving behavior to/from a CEX will cause changes in the token CEX Balance. And these behaviors will indicate the possible followed-up action by this trader.
| Metric | Condition | Signal |
| CEX Balance | Decrease | Bullish |
When the CEX Balance decrease, the withdrawal amount of the specific token is larger than the deposit amount. When a person withdraws tokens from a centralized exchange, he may probably transfer them to his wallet or a contract address for staking, etc. In either case, he is less likely to sell these tokens.
| Metric | Condition | Signal |
| CEX Balance | Increase | Bearish |
When the CEX Balance increase, the deposit amount of the specific token is larger than the withdrawal amount. When a person sends a certain amount of tokens to a centralized exchange, they are likely to sell these tokens after that. Namely, the more potential tradable tokens are in CEXs, the higher risk of an aggressive selloff in the market.