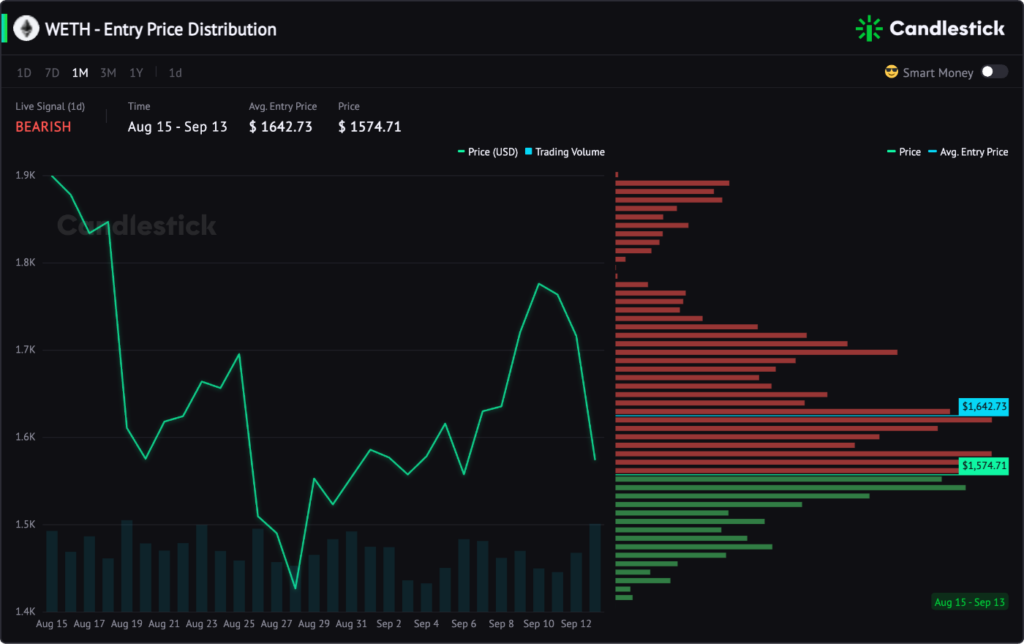
This article introduces the Entry Price Distribution chart and how to get signals from it.
Definition
The Entry Price Distribution illustrates a particular token’s price with trading volume and the distribution of the buy amount in a given time.

This metric is divided into two parts:
Price: the line chart on the left display the token price and trading volume in a period.
Entry Price Distribution: The bar chart on the right shows the number of tokens purchased at each price.
For example, suppose we detect three buy orders of 100 examplecoins each at $1, $2, and $3 in a given time, respectively. The Avg Entry Price will be $2 (100*(1+2+3)/100+100+100=2). At the same time, the distribution of these three buy orders will appear on the right, each showing amount of 100.
How can I use it?
The Entry Price Distribution is a new and exclusive token indicator developed by Candlestick. This metric allows you to know the buy prices of other traders. So, you can better master your investment’s entry timing by comparing.
1. Master Market Entry Timing
You can check this metric to find an investment timing beforehand when looking for opportunities to buy a particular cryptocurrency.
Compare two colored lines on the right of the chart:
Current Price: The green line.
Avg Entry Price: The blue line.
| Condition 01 | Note |
| Avg Entry Price > Current Price | The entry price of most traders is high. |
If you open a position, your costs may be lower than others. However, check the Net Buy Value, DEX Trades, and more DEX Trading indicators to realize the real-time buy power and sell pressure before you make a decision.
| Condition 02 | Note |
| Avg Entry Price < Current Price | The entry price of most traders is low. |
When the current price is sky higher than the Avg Entry Price, if you buy in now, you may invest the token at a higher cost than others. Check the Token Balance Distribution, Top Holders, and more indicators to realize the trader’s position changes beforehand.
2. Identify What Price Triggers the Purchase
Sometimes, a special price will be regarded as a dip, leading to many buy orders. The Entry Price Distribution can help you find these magic price points by checking the bar chart on the right.
Length of bars: The longer the horizontal bars are, the more buy amount at those prices, and vice versa.
If you find that traders are buying massive coins at a specific price, check the Net Buy Value, Trading Volume, and Turnover Rate metrics to verify if it is a key resistance or support.