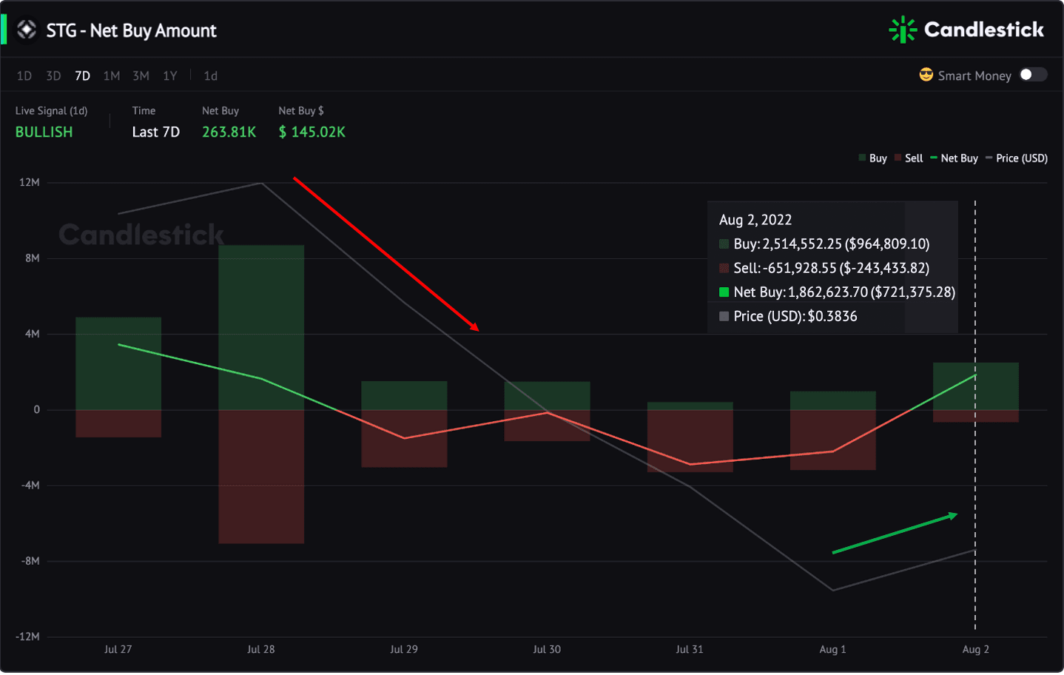
STG Rally Signals
Net Buy Amount ended 4-days-negative & saw green again on Aug 2.
Switch to 3d/1h resolution, the buy power on Aug 3 is even stronger than 2nd.
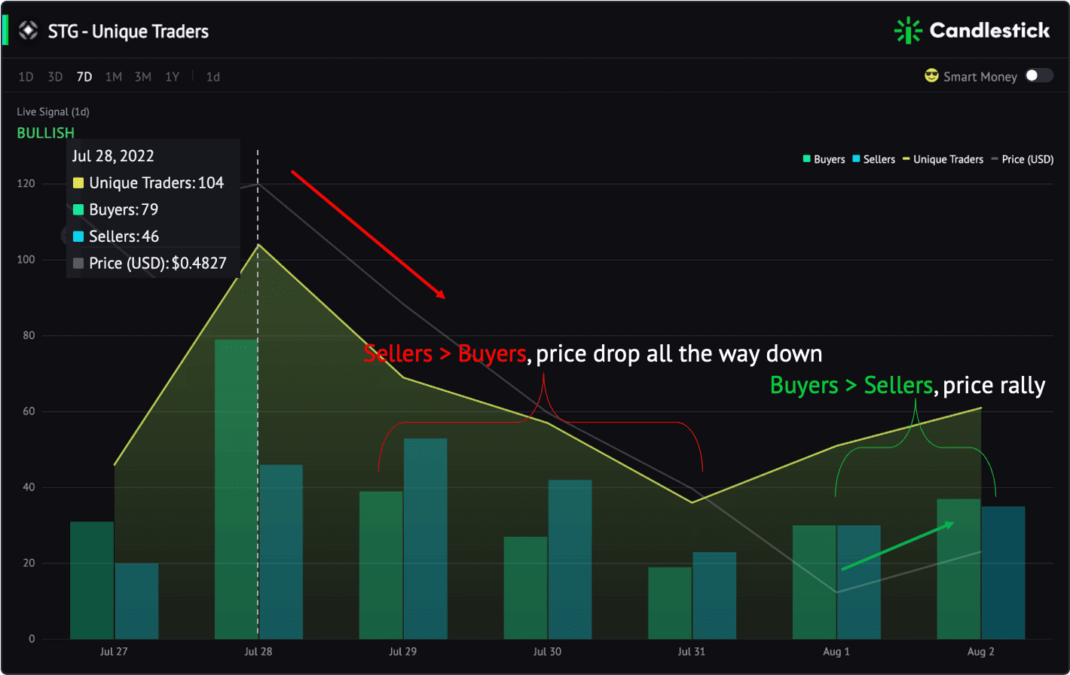
On Jul 29, sellers increased, and buyers sharply decreased. Sellers > buyers, the price started to drop.
On Aug 1, seller = buyers, the price rallied.
This metric is free to access.
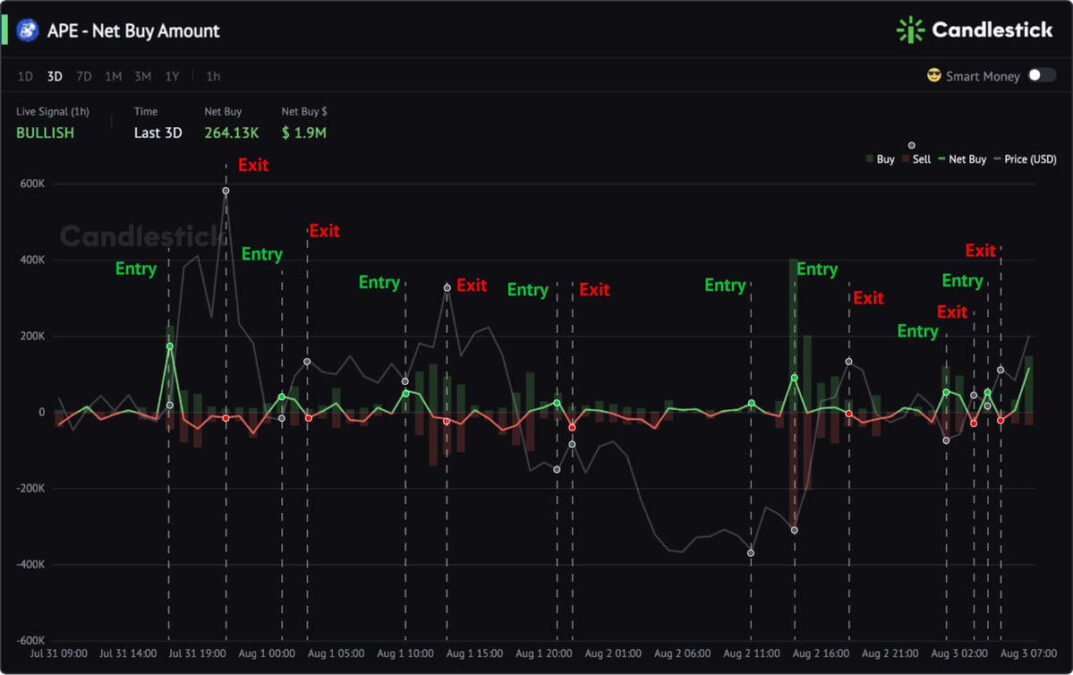
APE - The Divergence of Net Buy Amount & Token Price Signals Entry & Exit time
This is super useful especially in a flucated token price. The more fluctuations, the more you can get through using Net Buy Amount for your swing trading.
Take the APE chart below, for example. APE fluctuates between $6.29 and $7.48 in these 3 days.
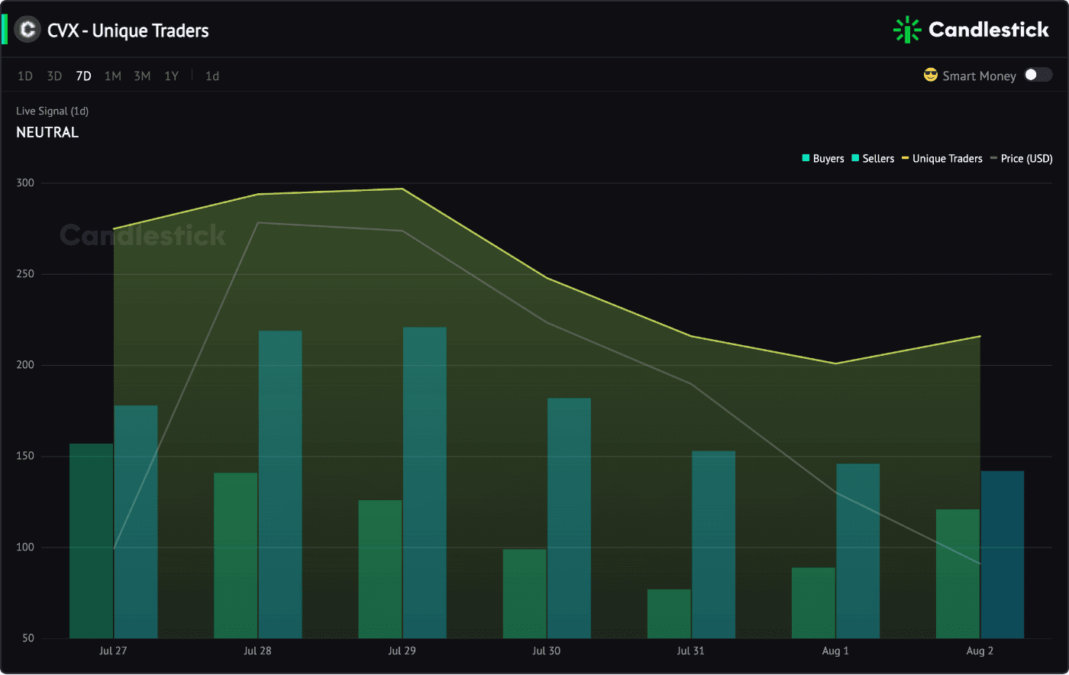
CVX - Rallied But 2 Signals To Watch
Net Buy Amount Remains Negative & No Sign To Revert Yet
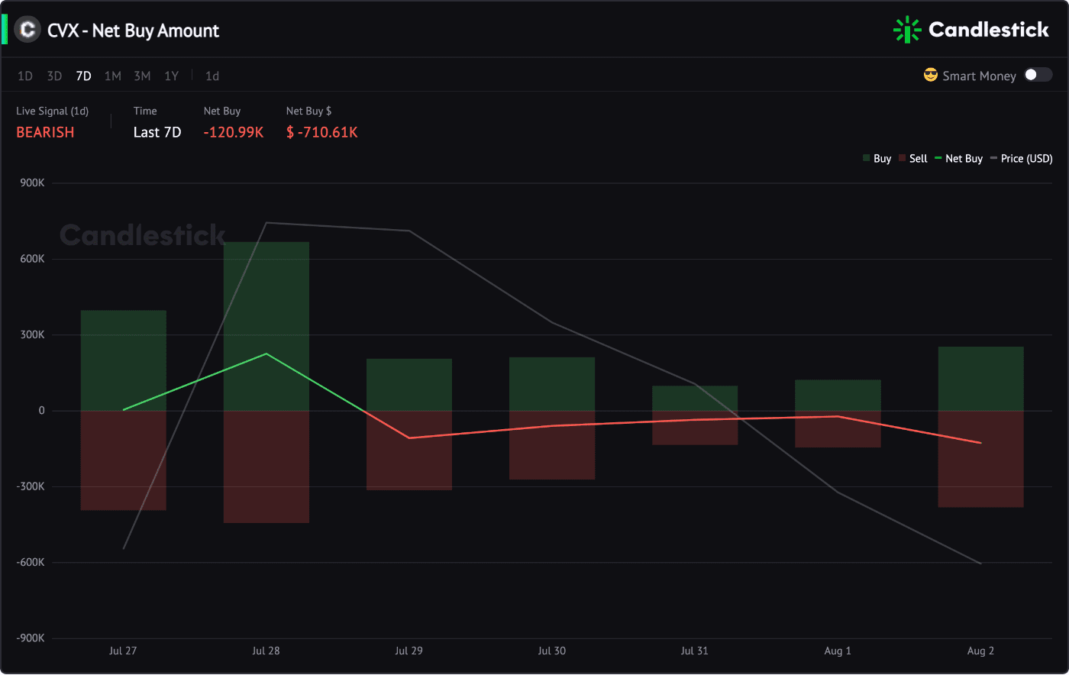
A 3-day largest Net Sell occurs when the price dropped to $6.93.
Daily Sellers Are 2x Larger Than Buyers In The Past 7 Days
Chasing Alpha with Smart Money on Candlestick
- DEX Trading: Net Buy Amount, Turnover Rate, etc.
- Liquidity Movement: Net Add Amount for Liquidity, Liquidity Providers, etc.
- Buy/Sell Pressure: Approved Sellable Amount on DEXs, Token Balance Distribution, etc.
- Exchange Flow: Net CEX Outflow, CEX Flow, etc.