Candlestick provides 20+ Signals & 40+ Exclusive Charts & Metrics, covering tokens on Ethereum, BNBchain, Polygon & Arbitrum.
You can analyze macro to micro using our indicators.
How?
- Find the most price-correlated chart to see the whole trend
- Look into movements of addresses to analyze
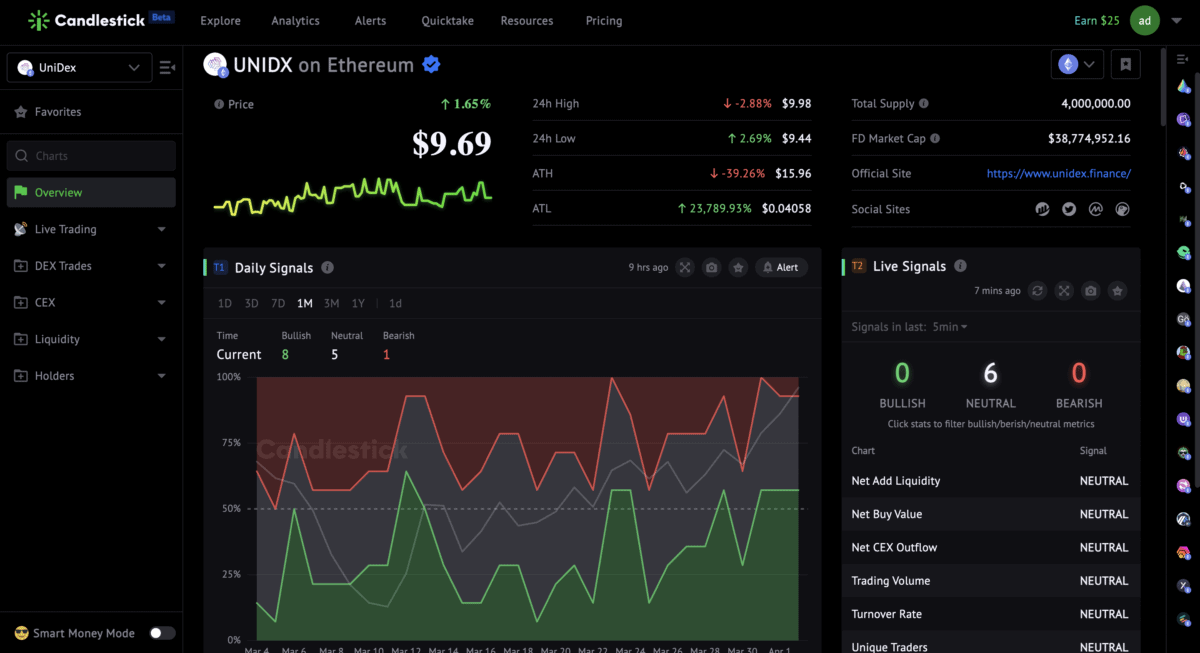
Take $UNIDX, for example. This token has rebounded 104% in the past 24 days, rising from $4.77 to $9.69.
Find The Most Correlated Metric
$UNIDX supply on exchanges is 100% on DEXs.
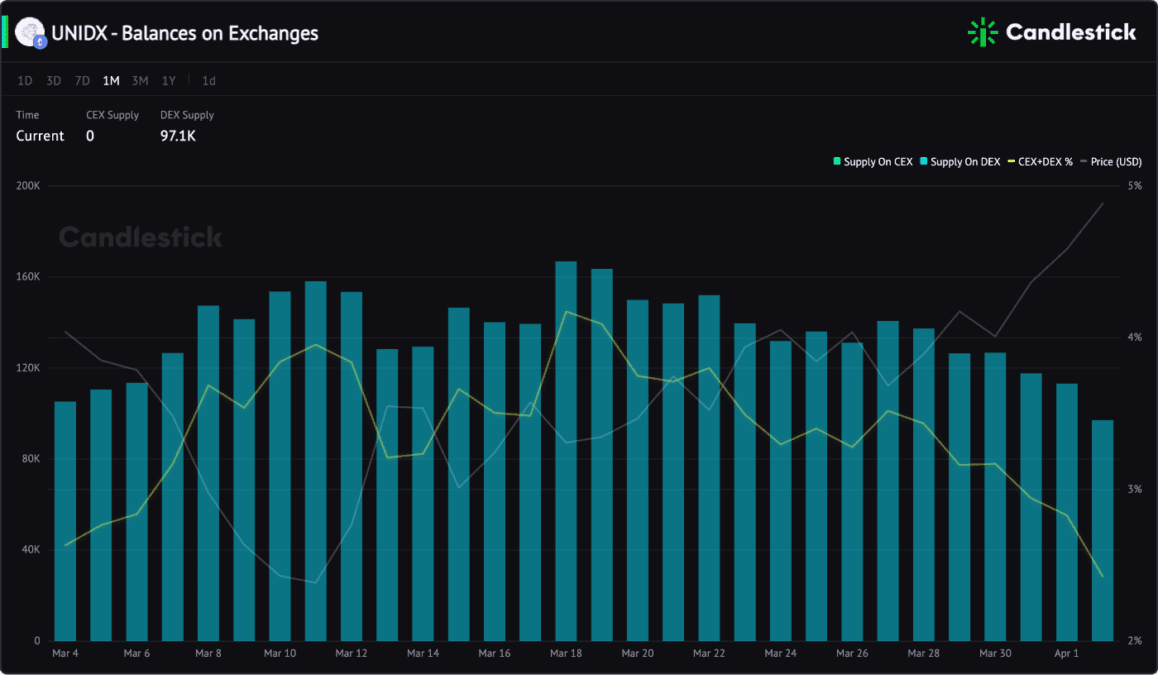
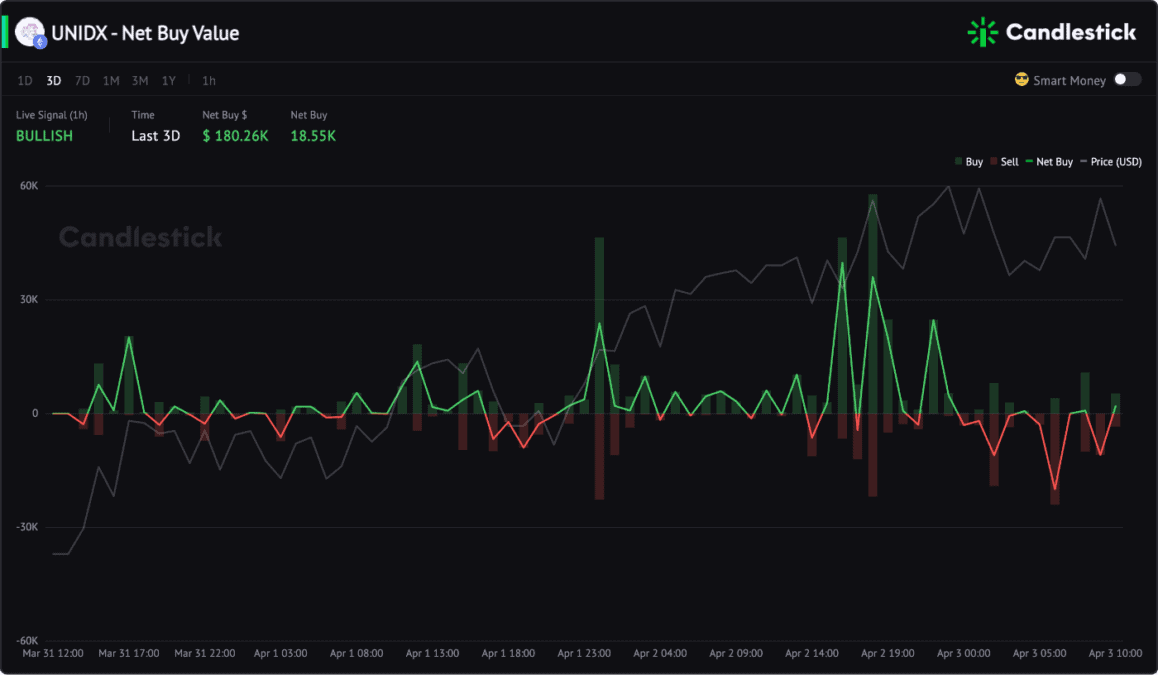
So, the DEX Net Buy Value indicator correlates with the $UNIDX price.
You can see the 3-day Net Buy Value chart below; when the Net Buy turns positive, the price increases and vice versa.
The 7-day chart also shows the rules.
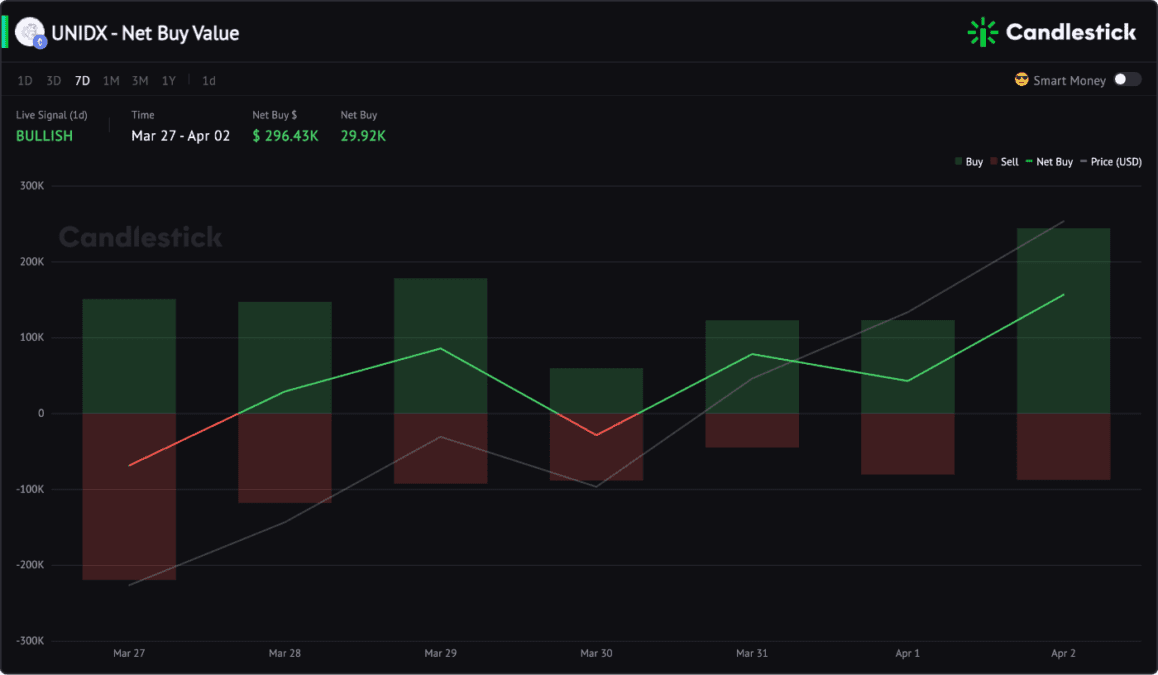
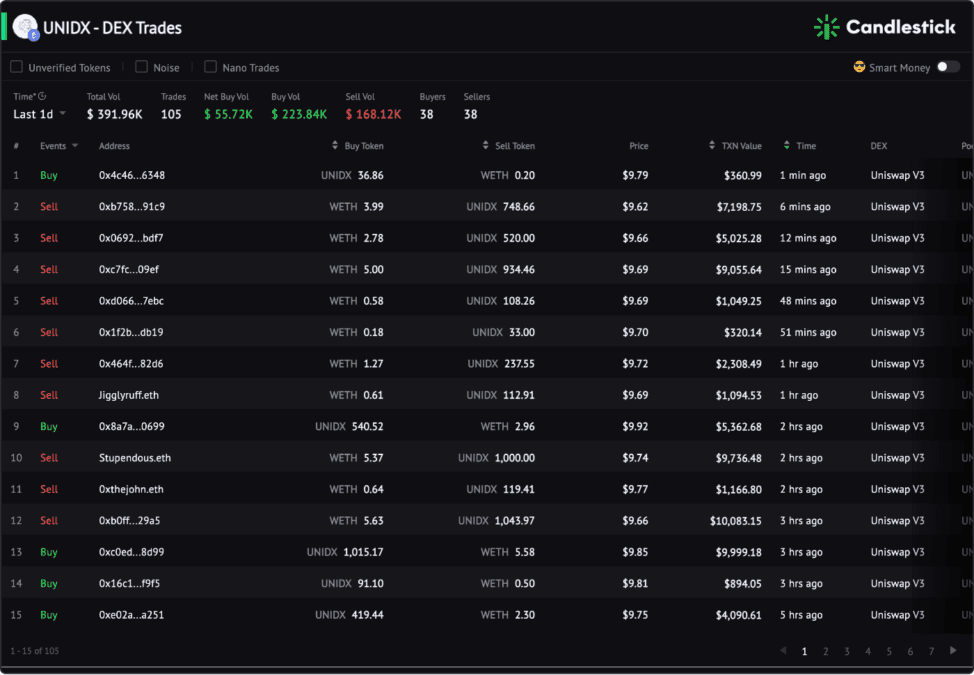
The live DEX trading data shows that the Net Buy Value is positive in 24h, so the price is green.
Track Addresses
In addition to searching for charts with strong price correlations for trend analysis, real-time monitoring of addresses with large transactions can better assist you in trading.
For example, on Mar 31, $26K $UNIDX liquidity was removed by liquidity provider 162c.
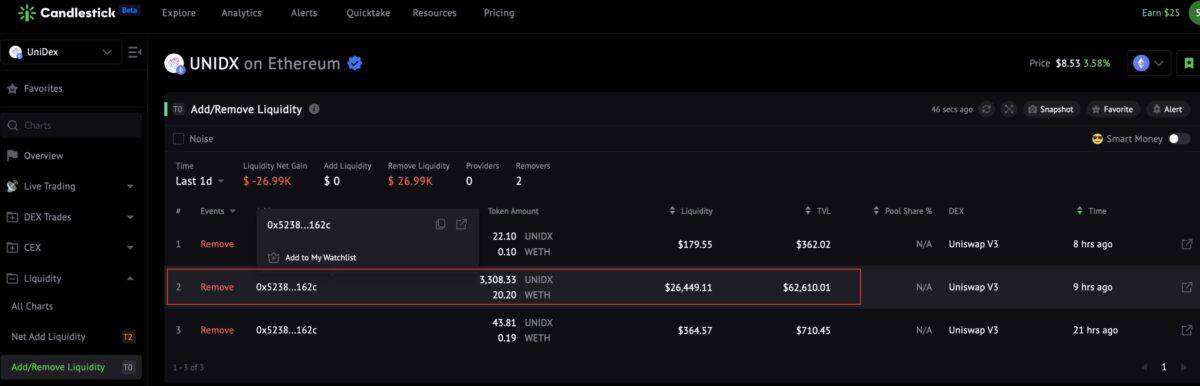
Usually, liquidity providers sell tokens after removing liquidity. However, you need to identify these actions through on-chain tracking carefully.
162c did not sell the tokens. Instead, he bridged all $UNIDX to Optimism.
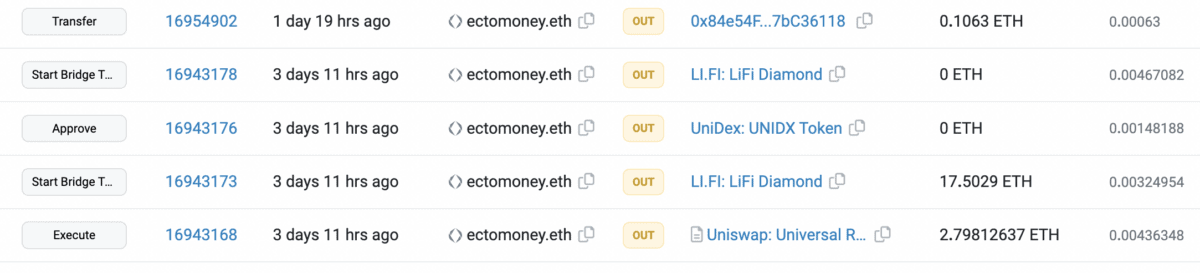
Therefore, this behavior is not a bearish signal.